U.S. Chemical Manufacturers Grew Despite Overall Manufacturing Decline
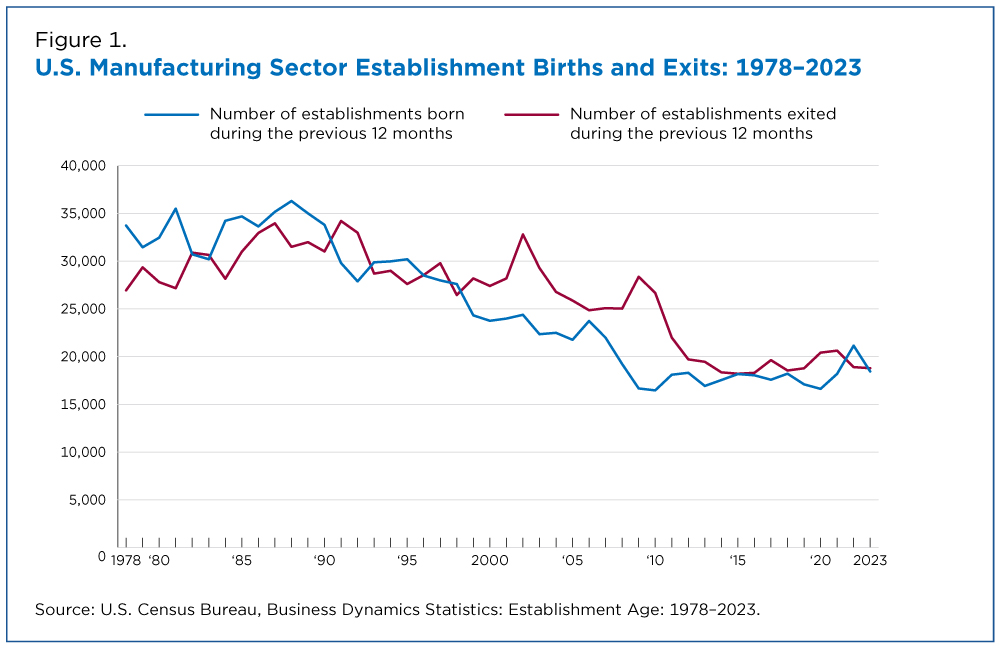
Most people may not realize the close connection they have with the Chemical Manufacturing industry, but it’s a subsector that helps create commonplace products we all use, from ink and soap to plastics and medicine. And it’s a portion of American manufacturing that has grown in recent years, running counter to the overall decline in manufacturing establishments and firms from 2017 to 2022, according to the most recent Economic Census. Expanded industrial production by pharmaceutical companies was a big contributor to the boost in Chemical Manufacturing. The North American Industry Classification System (NAICS) defines chemical manufacturing as the transformation of raw materials by a chemical process into everyday products. Businesses that manufacture chemicals run the gamut from refining oil into margarine to synthesizing willow bark into aspirin. The number of U.S. Chemical Manufacturing establishments (NAICS 325) increased 10.2% from 13,571 in 2017 to 14,961 in 2022 while the number of Manufacturing sector establishments as a whole decreased 1.7% during the same period, from 291,586 to 286,626, according to 2022 Economic Census data. Chemical Manufacturing value of shipments also increased by 22.4% during that period, rising from about $735.9 billion to $901.0 billion (the data are not adjusted for price changes). Industries with Chemistry What were the catalysts for growth? Expanded industrial production by pharmaceutical companies was a big contributor to the boost in Chemical Manufacturing. Production workers’ annual hours in the Pharmaceutical and Medicine Manufacturing industry (NAICS 32541), increased from 270.1 million to 341.6 million from 2017 to 2022, according to 2022 Economic Census data. Until recently, chemical manufacturer numbers loosely followed the trends in the broader Manufacturing sector. The 1978 to 2023 Business Dynamics Statistics (BDS) show that the manufacturing sector in general had a double-digit annual rate of new establishments until the early 1990s, when the number that shut down began to outstrip the newcomers (Figure 1). The highest-ever rate of Chemical Manufacturing establishment “births" — newly created establishments — occurred in 2022. “Exit” rates — the share of establishments that closed — peaked decades earlier and have been rising, with 2022 and 2023 marking the highest level in 20 years (Figure 2). Better Employment Through Chemistry? Despite growth in the Chemical Manufacturing industry, job numbers in industries downstream from these firms were in flux (Figure 3). Between 2017 and 2022, the number of pharmacists, chemical engineers, and chemists and material scientists increased about 28.1%, 54.5% and 24.8%, respectively. Chemical technicians, however, experienced a 2.2% decrease over the same period. The number of Pharmacies and Drug Stores establishments declined along with employment in the industry between 2017 and 2022. Overall, employment in Pharmacies and Drug Stores decreased by about 5.6%. Geographic Locations Chemical Manufacturing firms and revenues weren’t spread evenly across the nation. In 2023, a significant portion of the industry’s workforce was concentrated in the South and Midwest, with 334,398 and 242,706 employees, respectively, according to the 2023 Annual Integrated Economic Survey (Table 1). Chemical Competition How competitive was the Chemical Manufacturing subsector? A look at “concentration ratio,” or the market share held by an industry’s largest companies, can provide information about that industry’s competitiveness. A high concentration ratio indicates that the biggest companies own a large portion of a given industry, which can stifle competition, increase prices and hamper innovation. For example, the four largest firms in the Petrochemical Manufacturing industry (NAICS 325110) illustrate a much higher level of concentration, accounting for approximately 74.2% of the industry’s $77.6 billion in value of shipments for 2022. In contrast, an industry like Medicinal and Botanical Manufacturing (NAICS 325411) is relatively less concentrated. The top four firms accounted for about 24.7% of the industry’s $13.9 billion in value of shipments in 2022. Manufacturing Data Resources To learn more about Chemical Manufacturing workforce statistics, including earnings, hours and workplace trends, visit the Bureau of Labor Statistics “Industries at a Glance”. For additional resources to the latest manufacturing data, visit the Census Bureau’s Economic Briefing Room. Lynda Lee is a supervisory survey statistician at the Census Bureau. Travis Shoemaker is a writer/editor at the Census Bureau. This article was filed under: Business and Economy Employment Related Statistics Business and Economy The Census Bureau produces economic data from across the entire U.S. economy on a monthly, quarterly, yearly, and five-year basis. Manufacturing Week The U.S. Census Bureau joins the celebration by providing a week's worth of rich content, including statistics that inform businesses and policymakers. Subscribe Our email newsletter is sent out on the day we publish a story. Get an alert directly in your inbox to read, share and blog about our newest stories. Sign Up Today Contact our Public Information Office for media inquiries or interviews.