五度易链产业数字化管理平台
Urgent investigation as measles cases spread in London

London has been impacted by a recent outbreak of measles cases, largely affecting unvaccinated children in North London. More than 100 confirmed measles cases have been recorded in London since the start of 2026, with the majority affecting unvaccinated children in North London. Figures from the UK Health Security Agency show 104 confirmed cases in the capital, including 59 in Enfield alone as one of the areas with the lowest vaccination uptake in the country. Cases are also spreading to neighbouring Haringey. The London Assembly Health Committee will hold an extraordinary meeting on Monday, to examine the impact of the outbreak, how authorities are working to contain the spread, and what more can be done to increase vaccination rates and protect Londoners. The guests are: Panel 1: 09:30-10:30 Dr Yimmy Chow, Regional Deputy Director, UKHSA London Nalini Iyanger, Consultant in Health Protection, UKHSA Dudu Sher-Arami, Director of Public Health for Enfield Dr Sonali Kinra, North Central London Integrated Care Board Panel 2: 10:30-11:30 Dr Yimmy Chow, Regional Deputy Director, UKHSA London Susan Elden, Consultant in Public Health, NHS England (London) Katherine Richardson, GLA Director of Resilience Emma De Zoete, GLA Group Deputy Director of Public Health The meeting will take place on Monday 9 March 2026 from 9.30am in the Chamber at City Hall, Kamal Chunchie Way, E16 1ZE. Media and members of the public are invited to attend. The meeting can also be viewed LIVE or later via webcast or YouTube. Follow us @LondonAssembly.

来源:London发布时间:2026-03-06
Coming up next week at the London Assembly - w/c March 9th

PUBLICATIONS Wednesday 11 March Weight Loss Medication Health Committee The Health Committee will publish its report into private and NHS use of and access to weight loss medication in London, after an investigation which heard evidence from people with lived experience, manufacturers, distributors and medical professionals. MEDIA CONTACT: Daniel Zikmund on 07860 647 577/ [email protected] PUBLIC MEETINGS Monday 9 March Measles outbreak in London Health Committee – The Chamber, City Hall, Kamal Chunchie Way, 9.30am The London Assembly Health Committee will hold an urgent meeting to examine the impact of the measles outbreak, how authorities are working to contain the spread, and what more can be done to increase vaccination rates and protect Londoners. The guests are: Panel 1: 09:30-10:30 Dr Yimmy Chow, Regional Deputy Director, UKHSA London Nalini Iyanger, Consultant in Health Protection, UKHSA Dudu Sher-Arami, Director of Public Health for Enfield Dr Sonali Kinra, North Central London Integrated Care Board Panel 2: 10:30-11:30 Dr Yimmy Chow, Regional Deputy Director, UKHSA London Susan Elden, Consultant in Public Health, NHS England (London) Katherine Richardson, GLA Director of Resilience Emma De Zoete, GLA Group Deputy Director of Public Health MEDIA CONTACT: Daniel Zikmund on 07860 647 577/ [email protected] Tuesday 10 March Are London’s homes ready for a heatwave? Planning & Regeneration Committee – The Chamber, City Hall, Kamal Chunchie Way, 10am The Planning & Regeneration Committee will explore the risk of overheating in London and how this risk is likely to evolve in the future, and examples of best practice for dealing with heatwaves in the built environment. The guests are: Panel 1: 10-11.20 Emma Howard Boyd CBE, former Chair of the London Resilience Review Polly Turton, Head of Climate Action and Public Health, Shade the UK Dr Mehri Khosravi, Senior Research Fellow, University of East London Panel 2: 11.30-13.00 Matthew Scott, Policy Manager, Chartered Institute of Housing Dr Anna Mavrogianni, Professor of Sustainable, Healthy and Equitable Built Environment, Bartlett School of Environment, Energy and Resources, University College London Dr Joel Callow, Founding Director, Beyond Carbon Ed Hezlet, Head of Energy, Centre for British Progress MEDIA CONTACT: Daniel Zikmund on 07860 647 577/ [email protected] Wednesday 11 March Met Police Cybercrime unit Police & Crime Committee – The Chamber, City Hall, Kamal Chunchie Way, 10am The London Assembly Police and Crime Committee will explore online fraud in London, focusing on the work of the Met’s Cyber Crime Unit, how the Met works with partners to tackle online fraud, and how it supports victims. Guests include: Will Lyne, Head of Economic and Cybercrime, Metropolitan Police Guest TBC, City of London Police Guest TBC, Report Fraud Rory Innes, CEO and Founder, The Cyber Helpline Ruth Halkon, Research Manager, The Police Foundation MEDIA CONTACT: Tony Smyth on 07763 251727 / [email protected] Thursday 12 March GLA Savings & Efficiency plans GLA Oversight Committee - The Chamber, City Hall, Kamal Chunchie Way, 10am The Mayor has asked the Greater London Authority (GLA) to identify opportunities to work more efficiently. This could mean the net loss of 100 posts from the GLA’s establishment which equates to 200 staff at risk of redundancy. A collective consultation with UNISON and individual affected members of staff is underway. The GLA Oversight Committee will question the Chief Officer, Mary Harpley about the proposals. MEDIA CONTACT: Alison Bell on 07887 832 918 / [email protected] Thursday 12 March Rough Sleeping in London Housing Committee - The Chamber, City Hall, Kamal Chunchie Way, 2pm The London Assembly Housing Committee will examine how people sleeping rough in London are identified and supported, assess the effectiveness, consistency and timeliness of current arrangements to support people sleeping rough across London and scrutinise the impact of Mayoral initiatives to support people sleeping rough. The guests are: Panel 1: 14.00-15.30 Jess Turtle, Founder and Co-director of the Museum of Homelessness Greg Hurst, Director of Communications and Public Engagement, Centre for Homelessness Impact Sophie Boobis, Head of Research and Policy, Homeless Link Jillian Thursby, Service Director, St Mungo’s Panel 2: 15.35-16.50 Simone Meila, Head of Housing Solutions, London Borough of Camden David Eastwood MBE, Strategic Lead for Rough Sleeping, London Borough of Westminster Molly Bishop, Rough Sleeping Manager, Greater London Authority (GLA) Ellen Storrar, Head of Specialist Housing and Services, GLA MEDIA CONTACT: Daniel Zikmund on 07860 647 577/ [email protected]

来源:London发布时间:2026-03-06
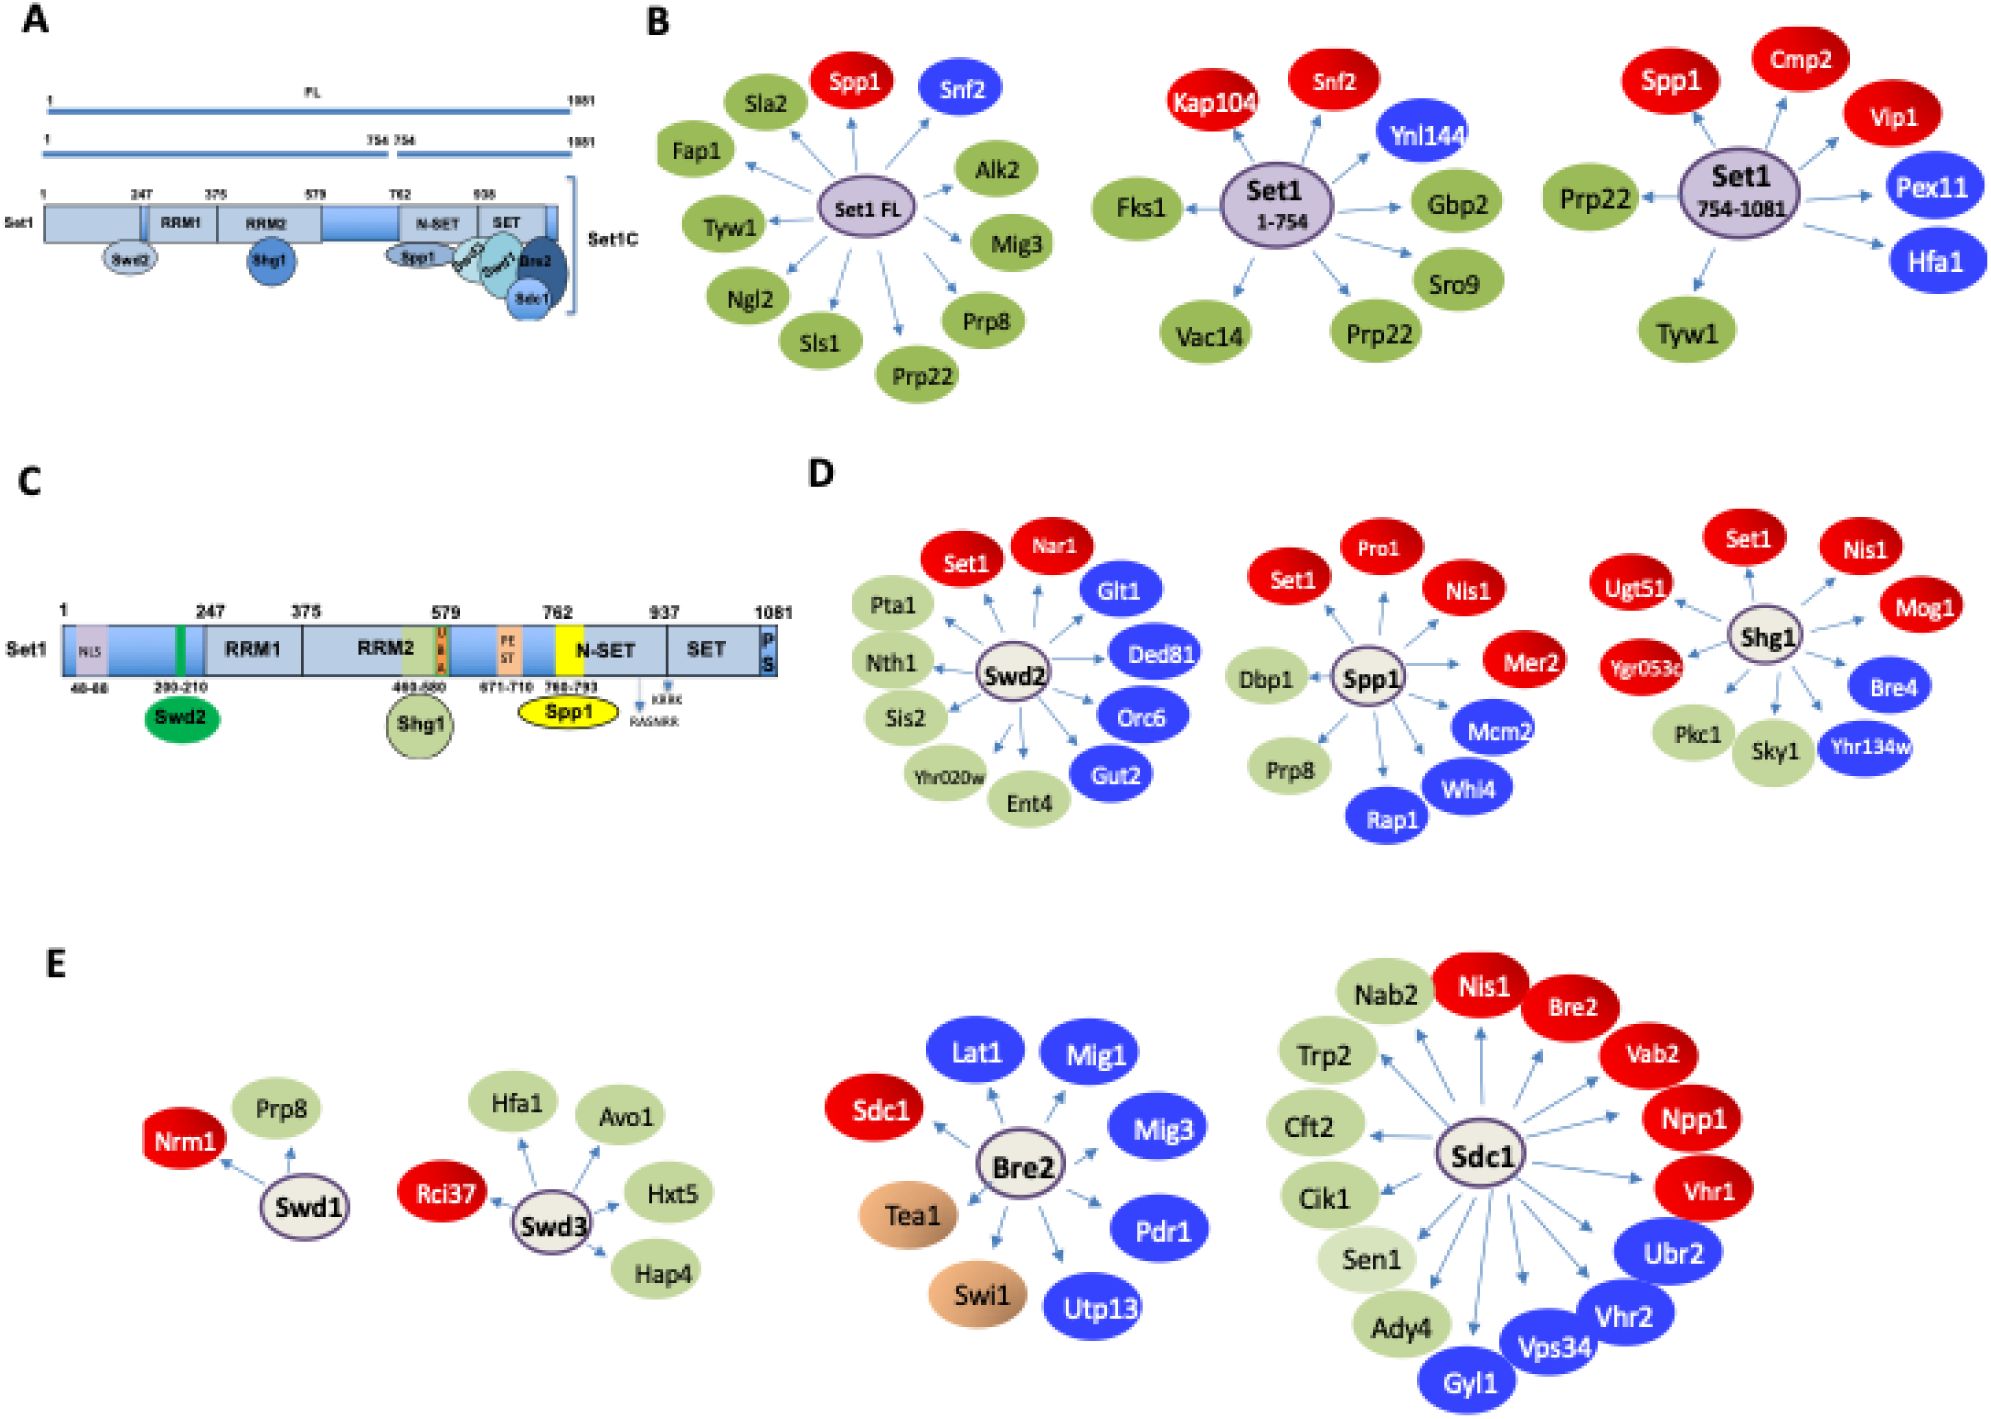
Systematic yeast two-hybrid screening identifies novel functions for SET1C/COMPASS

AbstractSet1 is the catalytic subunit of SET1C or COMPASS, which methylates histone H3K4 and serves as a scaffold for the association of seven tightly bound polypeptides. We have employed yeast two-hybrid screenings to determine the interactome of Set1 and each subunit, providing a unique resource for exploring known and novel roles of the complex. Our screenings identified a multitude of interactors involved in chromatin regulation, DNA replication, meiotic breaks, and Ty transposition, processes previously associated with SET1C. Consistent with Set1 being an RNA-binding protein, the screens link SET1C to multiple aspects of RNA biogenesis, including pre-mRNA splicing and polyadenylation. The results reveal that Set1 interacts with several importins and with RGG motif-containing proteins, providing insights into the mechanisms by which Set1 moves between cytoplasmic and nuclear compartments. We demonstrate that the transcriptional corepressor Nrm1 is methylated by SET1C in vitro suggesting that H3K4-like domains may represent a class of non-histone substrates for SET1C. We further reveal that reconstituted SET1C interacts with the AT hook domain of the chromatin remodeler Snf2 and methylates multiple arginines within this domain. In vivo, we report that the ARTSTRGR AT-hook motif is methylated in a Set1-dependent manner revealing new interplay between lysine and arginine methylation.IntroductionPost-translational modifications of histones shape the chromatin landscape and provide essential mechanisms of regulating DNA accessibility, thereby controlling gene expression, genome maintenance and transmission. Multiprotein complexes of the SET/MLL family methylate histone H3 on lysine 4 (H3K4), which modulates multiple aspects of genome biology (Ruthenburg et al, 2007). Each complex contains additional factors specifying their recruitment to explicit chromatin domains and their specific biological effects (Cenik & Shilatifard, 2021). The budding yeast Set1 complex called COMPASS (for Complex of Proteins Associated with Set1) or SET1C has proved to be an excellent model to study the SET1/MLL family complexes. In Saccharomyces cerevisiae, all H3K4 methylation is carried out by SET1C that is composed of Set1, the catalytic subunit, acting as a scaffold for seven other components (Swd1 [RbBP5], Swd2 [WDR82], Swd3 [WDR5], Bre2 [ASHL2], Sdc1 [DPY30], Spp1 [CFP1] and Shg1 [BOD1]) (Nagy et al, 2002; Briggs et al, 2001; Roguev et al, 2001; Miller et al, 2001). Swd1, Swd3, Bre2 and Sdc1 copurify with the SET domain of Set1, yet none of these proteins can interact alone with the SET domain, suggesting that interactions between subunits are required for catalytic domain formation (Kim et al, 2013). The crystal structure of the SET domain of Set1 associated with Swd1, Swd3, Bre2, Sdc1 shows that the catalytic module is organized by Swd1, whose C-terminal tail nucleates Swd3 and a sub-complex formed by Bre2-Sdc1 (Qu et al, 2018; Hsu et al, 2018). For its side, Spp1 associates with the N-SET domain of Set1, while Shg1 binds to the central region of Set1 and Swd2 contacts the N-terminal region of Set1 (Kim et al, 2013; Roguev et al, 2001; Dehe et al, 2006; Halbach et al, 2009). Swd1 contacts Spp1 and also interacts with the N-terminal region of Set1, suggesting that the C- and N-terminal regions of Set1 may interact with each other (Qu et al, 2018; Acquaviva et al, 2013b; Jeon et al, 2018). Such SET1C organization was confirmed by cryo-electron microscopy and cross-linking experiments performed on the full-length complex (Wang et al, 2018). Interestingly, SET1C has a remarkable mode of assembly that is initiated in the cytoplasm while the nascent Set1 polypeptide emerges from the ribosome. Set1 is initially bound during its translation, by Shg1, Spp1 and Swd1, then Swd2, Swd3, Bre2 and Sdc1 associate with the initial pre-complex to form the full SET1C. This explains why Set1 is associated with its own mRNA (Luciano et al, 2017; Halbach et al, 2009).Swd2, the only essential SET1C subunit, is also part of the APT complex (for Pta1-associated), a subcomplex of the Cleavage Polyadenylation Factor (CPF) involved in the transcriptional termination of mRNA and snoRNA suggesting a functional link between SET1C and 3’ end formation/termination (Cheng et al, 2004; Nedea et al, 2003; Dichtl, 2004). Set1 has also been linked genetically to the Nrd1-Nab3-Sen1 (NNS) complex (Kim et al, 2006; Arigo et al, 2006), but intriguingly, it was reported to have two seemingly contradictory effects on ncRNA termination: on the one hand Set1 was suggested to promote efficient snoRNA termination mediated by Nrd1 (Terzi et al, 2011), and on the other hand it appeared to interfere with the early termination of a large number of ncRNAs (Castelnuovo et al, 2014; Margaritis et al, 2012). Interestingly, various lysines distributed between Nrd1, Nab3 and Sen1, are methylated, notably lysine 363 in the RNA Recognition Motif (RRM) of Nab3 whose mono methylation depends on Set1 and Set3 (Lee et al, 2020).Set1 interacts co-transcriptionally with the RNA polymerase II Carboxy Terminal Domain (PolII CTD) phosphorylated on Ser5 of the heptad repeats, producing an H3K4 methylation gradient that starts at nucleosome +1 and fades away from the promoter (Soares et al, 2017; Ng et al, 2003). It was recently shown that the N-terminal region of Set1 and Swd2 interact cooperatively with the CTD (Carboxy Terminal Domain) of Rbp1 (RNA polymerase II large subunit) promoting SET1C recruitment to transcription elongation complexes at the 5′ ends of genes (Bae et al, 2020). Deletion of residues 200-210 of Set1 abolishes interaction with the Rpb1-CTD and Swd2, while deletion of the first 200 amino acids of Set1 strongly reduces trimethylation of H3K4 (H3K4me3) at the 5’ end of transcribed genes (Bae et al, 2020). Interestingly, Swd2 is ubiquitinated by Rad6/Bre1 and preventing Swd2 ubiquitination affects H3K4 trimethylation with a concomitant reduction in Spp1 recruitment to chromatin suggesting a cross-talk between Swd2 and Spp1(Vitaliano-Prunier et al, 2008). In a similar vein, di- and tri-methylation of H3K4 by Set1, which depends on prior ubiquitination of histone H2B by Rad6/Bre1 (Dover et al, 2002; Sun & Allis, 2002), requires a contact between Spp1 and Swd1 (Hsu et al, 2019; Jeon et al, 2018). Other modes of SET1C recruitment to chromatin must exist in the absence of the Set1 N-terminal region, probably via direct interactions between SET1C’s catalytic domain and the nucleosome (Jeon et al, 2018; Dehé & Géli, 2006; Thornton et al, 2014).The central region of Set1 contains two RRMs positioned in tandem (Trésaugues et al, 2006) through which Set1 binds directly to RNA. This binding contributes to retain Set1 in the 5’ region of genes thus facilitating their H3K4 trimethylation (Luciano et al, 2017; Battaglia et al, 2017; Sayou et al, 2017). Both the N-SET domain and Spp1 also contribute to Set1 binding to RNA. Set1 associates post-transcriptionally with transcripts produced by specific classes of genes including snRNA, Ty1 and a number of genes involved in adaptive responses (Luciano et al, 2017). The dRRM itself is flanked by an autoinhibitory region that negatively regulates H3K4me3 (Schlichter & Cairns, 2005). It is possible that in the context of full-length Set1, the alternative mode of SET1C recruitment may be inhibited by the autoinhibitory domain.In S. cerevisiae, H3K4me3 methylation is counteracted by the demethylase Jhd2, a conserved JARID1 family protein (Huang et al, 2010; Liang et al, 2007). The erasure of ancestral histone methylation states results from both active enzymatic demethylation by Jhd2 and passive dilution of parental histones during replication (Radman-Livaja et al, 2010). SET1C is a dimer and its dimerization depends on the Sdc1 subunit (Choudhury et al, 2019). It has been proposed that the symmetrical methylation of H3K4 on nucleosomes is a consequence of the dimeric nature of SET1C and that Jhd2 preferentially demethylates asymmetrical H3K4me3 (Choudhury et al, 2019). Interestingly, H3K4me3 at environmental stress genes depends on H3-P16 isomerisation, a process that controls K4me3 by balancing the actions of Jhd2 and Spp1 (Howe et al, 2014).The complexity of the S. cerevisiae SET1C, the specific arrangement of subunits within the complex, and the specific roles of certain subunits, notably Spp1 and Swd2 (Acquaviva et al, 2013a), raise the question of the contribution of SET1C and of its subunits to multiple processes. Overall, H3K4 methylation, SET1C and its individual subunits have been involved in multiple processes in S. cerevisiae such as meiotic recombination (He et al, 2019; Sollier et al, 2004; Borde et al, 2008; Acquaviva et al, 2013b; Sommermeyer et al, 2013; Karányi et al, 2018; Adam et al, 2018), stress response and epigenetic transcriptional memory (D’Urso et al, 2016; Kim & Buratowski, 2009; Weiner et al, 2012), DNA repair (Faucher & Wellinger, 2010), telomere and rDNA silencing (Jezek et al, 2023; Corda et al, 1999; Briggs et al, 2001; Bryk et al, 2002; Santos-Rosa et al, 2004; Nislow et al, 1997), cell wall biogenesis (Nislow et al, 1997), chromosome segregation (Beilharz et al, 2017; Zhang et al, 2000), antisense transcription (Murray et al, 2015; van Dijk et al, 2011; Margaritis et al, 2012; Castelnuovo et al, 2014), transcription termination (Kaczmarek Michaels et al, 2020; Nedea et al, 2003; Dichtl, 2004; Cheng et al, 2004; Nedea et al, 2008; Terzi et al, 2011; Soares & Buratowski, 2012; Castelnuovo et al, 2013; Lee & Wang, 2018), Ty silencing (Luciano et al, 2017; Berretta et al, 2008), chronological aging (Gong et al, 2023; Walter et al, 2014; Mei et al, 2019), ergosterol homeostasis (South et al, 2013), stress response (Deshpande et al, 2022; Nadal-Ribelles et al, 2015), lipid homeostasis (Giaever et al, 2019), and DNA replication (Ghaddar et al, 2023; Sollier et al, 2004; Rizzardi et al, 2012; Chong et al, 2020; Delamarre et al, 2020; Santos-Rosa et al, 2021; de La Roche Saint-André & Géli, 2021; Serra-Cardona et al, 2022).The multiple roles of Set1 and its subunits led us to perform global two-hybrid screening to identify interactors either of Set1-full length, or of its N- and C-terminal regions and of each of the individual subunits (Swd2, Shg1, Spp1, Swd1, Swd2, Sdc1, Bre2). The identification of interactors is discussed not only for each bait, but also as a whole, revealing new potential functions for the complex. In addition, we demonstrate that the transcriptional corepressor Nrm1 and the Snf2 AT-hook are both methylated by SET1C in vitro. In vivo, deleting SET1 abrogates arginine methylation within the ARTSTRGR motif of Snf2 AT-hook. These results suggest that H3K4-like sequences may represent a class of non-histone substrates for SET1C and reveal new interplay between Lysine and arginine methylation. This work is an invaluable resource for further exploring known and unsuspected roles of the SET1C complex and its subunits.ResultsIdentification of Set1 and Set1 subunits interactorsWe produced a total of ten yeast two-hybrid (Y2H) screens (Hybrigenics, See Methods). For the Set1 protein, we performed a total of three screens using as bait the full-length Set1 protein (Set1 FL), the amino-terminal region including amino acids 1-754 or a C-terminal fragment including amino acids 754-1081 (Fig. 1A). We have chosen to separate Set1 into these 2 regions because they have been described as having well-defined properties. The Set1 1-754 fragment includes the domain involved in Set1 recruitment to chromatin, the double RRM (Trésaugues et al, 2006), and the central self-inhibitory domain (Schlichter & Cairns, 2005) that all have regulatory roles (Dehé & Géli, 2006). The Set1 region 754-1081 contains the N-SET domain, the SET domain and the post-SET domain: the latter is capable of methylating H3K4 on its own (Thornton et al, 2014) (Fig. S1). For each of the subunits (SU) of the complex whose organization is described in Fig. 1A we used the whole protein as bait. Each gene encoding Set1 (and its fragments) or its subunits was cloned downstream the Gal4-BD except for Swd2 that was placed upstream the Gal4-BD. These screens have proven their power and effectiveness. In particular, they identified Mer2 as an interactor of Spp1 (Acquaviva et al, 2013b), and the CTD of Rpb1 as an interactor of the N-terminal region of Set1 (Bae et al, 2020) (Fig. S1). The results of the ten Y2H screens are presented in Fig. 1 and Table S2. Each interactor is characterised with a confidence score based on several criteria, including the frequency with which a prey protein is found for a particular screen and the presence of overlapping fragments, which allow the delineation of the interaction domain involved (see Methods). Very high confidence interactors (indicated by a color code) are likely to interact directly with their bait. For Set1 and its N- and C-terminal fragments, the high confidence Y2H interactors are shown in Fig. 1B. All interactors are shown in Table S2. The predicted protein-protein interactions within the Set1 interactors reveal functional information that is detailed in the following paragraphs. The high confident interactors of the seven SET1C subunits are shown in Fig. 1C-E. We found that Spp1, Shg1 and Swd2 interact alone with Set1 (Fig. 1C). The minimum Set1 region for which an interaction is found for each of these 3 subunits is shown in Fig. 1C. The high confidence interactors of the seven SET1C subunits are shown in Fig. 1C-E. We found that Spp1, Shg1 and Swd2 display Y2H interactions with Set1 (Fig. 1C). The high confidence interactors of Spp1, Shg1 and Swd2 are indicated in Fig. 1D (see also Table S2). In contrast, we did not find any interaction between Swd1, Swd3, Bre2 and Sdc1 (SET-c components) and Set1 in the various Y2H screens, suggesting that these subunits must cooperate to bind to Set1. Only Bre2 was found to interact with Sdc1 in both Sdc1 and Bre2 Y2H screens (Fig. 1E). These results are consistent with the structure of the extended SET1C catalytic module and full-length SET1C (Wang et al, 2018; Hsu et al, 2018; Qu et al, 2018).Figure 1.Schematic representation of the Set1 and subunit major interactors identified in the systematic yeast two-hybrid screens.A) Schematic representation of Set1 FL and Set1 fragments 1-754 and 754-1081. B) Set1 FL, 1-754 and 754-1081 major Y2H interactors). C) Interacting regions of Set1 with Swd2, Shg1 and Spp1. D) Swd2, Spp1, Shg1 major Y2H interactors. E) Swd1, Swd3, Bre2, Sdc1 major Y2H interactors. The term “interactor” is used to mean a high confidence two-hybrid interaction, with the limitations that this entails. The color reflects the Predicted Biological Score (see METHODS). Red, highest confidence; Blue, high confidence; Green, good confidence.Set1 1-754 interacts with the importin Kap104We found that Set1 1-754 interacted with very high confidence with the importin Kap104, suggesting a direct interaction (Fig. 2A). Kap104 has been reported to recognize specific cargos containing a specific class of NLS termed PY-NLS (Soniat et al, 2013; Xu et al, 2010). This PY-NLS includes a N-terminal or central hydrophobic or basic motif, which often contains hydrophobic (R/H/K) residues and which can include RGG repeats (arginine-glycine-glycine motifs) and a C-terminal Proline-Tyrosine (PY) dipeptide near the C-terminus. Such cargos include the mRNA export factor Nab2, the subunit of the THO/TREX complex Hrp1, and the transcription factor Tfg2 (Lee & Aitchison, 1999; Süel et al, 2008). Interestingly, Nab2 is a confident interactor of Sdc1 (Fig. 2A). The Set1 interacting domain (SID) of Kap104 extends from residue 359 to 621 and includes the HEAT-like repeat (Yoshimura & Hirano, 2016) (Fig. 2B). Consistent with this result, we identified two PY-NLS in the N-terminal region of Set1 that are likely recognized by Kap104 (Fig. 2C). Along the same line, Shg1, which binds RRM2, interacted with very high confidence with Mog1 (Oliete-Calvo et al, 2018). Mog1 has been involved in the modulation of the nucleotide state of Ran-GTP in the nucleus and of Ran-GDP in the cytoplasm, thereby conferring directionality to the nuclear import pathway (Baker et al, 2001). Mog1 has been reported to interact directly with the Ran homologue Gsp1 (Oki & Nishimoto, 1998) (Fig. 2A). We have also identified, Kap123, Msn5 (Kap142), Nup82 and Mtr10 as interactors of Set1 1-754 that are also involved in protein import/export (Fig. 2A). Kap123 is a major karyopherin that recognizes NLS of cytoplasmic H3 and H4 (An et al, 2017) while Msn5/Kap142 was shown to mediate the import into the nucleus of the subunits of RPA (Yoshida & Blobel, 2001). Nup82 for its part belongs to a module at the cytoplasmic face of the NPC and interacts with karyopherins (Beck & Hurt, 2017) (Fig. 2A). Finally, Mtr10 has been implicated in the nuclear import of the mRNA-binding protein Npl3 (Senger et al, 1998; Pemberton et al, 1997). Collectively, these multiple interactions reveal insights for understanding the nuclear import of Set1, which was reported to bind co-translationally with Shg1, Swd1, and Spp1 (Halbach et al, 2009).Figure 2.Set1 1-754 interacts with RGG proteins and the importin Kap104.A) RGG proteins and import/export proteins interacting with Set1 1-754, Set1 754-1081 and Spp1, Shg1, and Sdc1. B) Set1 interacting domain (SID) (blue) within Kap104. Heat like repeat 9 and 10 are represented in purple C) PY-NLS in the N-terminal region of Set1. D) SID (blue) and RGG motif (green) within the RGG proteins. The interaction domains indicated represent the minimal overlapping DNA sequence present in multiple independent Y2H interacting clones of the same gene. Each genomic fragment of a Y2H clone was analyzed, and the shared overlapping region for given gene was determined to be the only common element among all interacting clones. As such, this region represents the minimal sequence required for interaction.Set1 1-754 interacts with Snf2 and RGG motif proteinsSet1 1-754 and Set1 FL interacted with very high confidence with Snf2, the catalytic subunit of the SWI/SNF chromatin remodeling complex (Côté et al, 1994) (Fig. 1B). Interestingly, two additional Snf2 complex components, Snf5 and Swi1, have been identified in the Set1FL screen (Table S2). Together these observations strongly support the idea that the suggested interaction of Set1 and SWI/SNF is of biological significance (Hirschhorn et al, 1992). The various Y2H screens revealed Set1 and its subunits interacted with a number of proteins involved in chromatin structure regulation although the relevance of these interactions remains to be demonstrated (Fig. 3). Interestingly, the SID region of Snf2 is juxtaposed to an RGG motif composed of several RGG/RG repeats that is often found in RNA-binding proteins (Thandapani et al, 2013) and may be the substrate for arginine methyltranferases (McBride et al, 2005) (Fig. 2A, 2D). RGG repeats are multifunctional motifs that mediate RNA and DNA binding and nuclear import. They have been involved in RNA metabolism and chromatin dynamics possibly via arginine methylation, which modulates RNA affinity and nuclear localization (108). Along the same line, Set1 1-754 also interacted with the mRNA export factor Gbp2 (Poornima et al, 2021) and the nucleolar protein Nop1, both of which contain an RGG motif (Fig. 2A, 2D). Other RGG proteins such as polyadenylated RNA-binding protein Nab2 and the RNA-helicase Dbp1 interacted with Set1 754-1081 (and Sdc1) and Spp1, respectively (Fig. 2A, 2D). For each of these proteins, the putative SID includes the RGG motif. Of note, both Nop1 and Nab2 are methylated by the Arginine methyltransferase Hmt1 (Smith et al, 2020; Green et al, 2002).Figure 3.Chromatin regulators identified in all the two-hybrid screens.The lines indicate the individual proteins involved in the Y2H interaction. Red line refers to a very high confidence Y2H interaction. All Y2H interactors are described in Table S2. Interactors are grouped according to the complex to which they belong.Our screens indicate that the minimal region of Snf2 interacting with Set1 1-754 was located between Snf2 residues 1430-1499. We further refined this interaction by Y2H testing of five Set1 fragments covering the entire Set1 length against the Snf2 1349-1650 region. The two-hybrid analysis revealed that Snf2 (1349-1650) interacted with the N-terminal domain (Set1 1-230) and the N-SET region (Set1 762-938) (Fig. S2). To validate these interactions we obtained recombinant protein where GST was fused to the C-terminal domain of Snf2 (Snf2C), the AT-hook (Snf2C-AT-hook) and the Bromo domain (Snf2C-Bromo) (Kim et al, 2010) (Fig. 4A). We performed pull-down assays to test the interaction of the GST-fusion proteins with reconstituted SET1C or with the SET1C762 complex in which Set1 has a N-terminal truncation of the first 761 residues, respectively (See METHODS) (Fig. S3 A-E). We found that SET1C as well as the SET1C762 complex were both associated with Snf2C and Snf2C-AT-hook but not to Snf2C-Bromo (Fig. 4 B, C), indicating that AT-hook is a key region for interaction with SET1C. We then delineated the minimal AT-hook region required for interaction with SET1C and found that residues 1461-1547 are essential for binding to SET1C (Fig. 4 D-E). Collectively, these results indicate that SET1C interacts with Snf2C-AT-hook region suggesting that the Set1 and Snf2 complexes cooperate to modify chromatin structure.Figure 4.SET1C interacts in vitro with Snf2C-AT-hook.A) A schematic diagram depicting the domains of Snf2 and the Snf2 fragments used in this study, along with the SDS-PAGE/Coomassie staining of the purified GST-tagged Snf2 fragments. B and C) GST pull-down assay using purified GST-tagged Snf2 fragments. The purified SET1C (B) or SET1C-C762 complex (C) was mixed with GST-tagged Snf2 fragments, followed by GST pull-down, and the bound proteins were analyzed by immunoblotting. D) A schematic diagram illustrating Snf2 fragments with a more detailed breakdown of the AT-hook domain, along with the SDS-PAGE/Coomassie Blue staining of the purified Snf2 fragments. The lysines present in the AT-hook are represented by the letter K. E) GST pull-down assay using purified GST-tagged Snf2 fragments and SET1C.SET1C is involved in multiple aspects of RNA biogenesisSet1 was previously shown to bind RNA nascent transcripts through its dRRM contributing to position Set1 and H3K4me3 predominantly to the 5′ regions of genes. Of note, Set1 showed a higher occupancy within introns, at transcripts from ribosomal DNA (rDNA), and tRNAs (Luciano et al, 2017; Battaglia et al, 2017; Sayou et al, 2017). Moreover, Set1 also binds post-transcriptionally to Ty1 retrotransposon transcripts and mRNA encoding specific transcription factors genes (Luciano et al, 2017). The SET1C Y2H interactome revealed that many proteins involved in RNA biogenesis were interacting directly or indirectly with Set1 or its subunits (Fig. 5). We find a strong connection between SET1C and pre-mRNA processing, as highlighted by the identification of multiple spliceosome subunits (Fig. 5). Some spliceosome subunits were found in several screens (Fig. 1B, D; Table S2). For instance, the Prp8 subunit of the U5 snRNP that function in critical molecular rearrangements during the splicing process (Grainger & Beggs, 2005) interacted with Set1 FL, Spp1, and Swd1. Similarly, Prp22 interacts with Set1FL and Set1 754-1080. Prp22 is a DEAH-box helicase that associates with newly spliced mRNA and promotes its release from the spliceosome (Will & Lührmann, 2011). We have refined the interaction region between Set1, Prp8 and Prp22, showing that Prp8 and Prp22 interact strongly with Set1-F4. (n-SET). Prp22 interacts in addition with Set1-F1 (Fig. S2). We have further strengthened the link between Set1 and Prp22 by showing that Set1 is co-immunoprecipitated with Prp22 in vivo in an RNA-independent manner. (Fig S4A, B). The preferential binding of Set1 to genes with introns (Luciano et al, 2017) and its interaction with splicing factors, in particular Prp22, suggest that Set1 may be involved in late splicing events. Alternatively, Prp22 and/or other splicing factors could be involved in H3K4 methylation.Figure 5.The SET1C Y2H interactome identifies proteins involved in RNA biogenesis.All Y2H interactors are described in Table S2. The processes linked to RNA metabolism in which the different interactors are involved are shown in the figure. The green lines linking Prp22 to Set1FL/Set1 754-1080 and Prp8 to Set1 FL and Spp1 indicate interactions with a high degree of confidence.We also found a number of factors involved in rRNA processing that could be related to the binding of Set1 to ncRNA transcripts derived from the rDNA intergenic spacer regions (Sayou et al, 2017) (Fig. 5). Next, and consistent with the observation that SET1C regulates the choice of the polyadenylation site and the recruitment of the cleavage/polyadenylation complex (Kaczmarek Michaels et al, 2020), the Y2H screens revealed multiple potential interactions between SET1C and factors involved in RNA polyadenylation (Fig. 5). Some of these interactions are known, such as the interactions between Swd2 with Pta1 and Ref2, all three proteins belonging to the APT complex (Nedea et al, 2008). Interestingly, we found that Set1 1-754 interacts with Not1 and Not4 that belongs to the ubiquitin-protein ligase CCR4-NOT (Liu et al, 2001) (Fig. 5). This complex was shown to be involved in the regulation of H3K4me3 via a ubiquitin-dependent pathway (Mulder et al, 2007; Laribee et al, 2007) that was subsequently linked to Jhd2 degradation (Huang et al, 2010; Mersman et al, 2009). These results raise the question of which of the Y2H interactions described in this study are linked to the regulation of H3K4 methylation states.Finaly and somewhat surprisingly, we found that many Y2H interactors of Set1 1-754 were involved in tRNA nuclear transport, modification, and synthesis (Fig. 5). Swd2, which interacts with the Set1 N-terminus, exhibit a 2H interaction with a high degree of confidence with the cytoplasmic asparaginyl-tRNA synthetase Ded81 and the prolyl-tRNA synthetase Yhr020 while Sdc1interacted with the glycyl-tRNA synthase Grs1 and Bre2 with the glutamine tRNA synthetase Gln4. Of note, Trm1 (Liu et al, 1998) and Trm732 (Guy et al, 2012) are both directly or indirectly involved in tRNA methylation and form part of what has been defined as the cell’s global methytransferome (Giaever et al, 2019).SET1C Y2H interactors are involved in several aspects of DNA transactionsAs mentioned in the introduction, it has been shown that SET1C, and in particular Spp1, regulate the selection of meiotic breaks, the progression of the replication fork, DNA repair, chromosome segregation, and transposition of Ty elements (Deshpande & Bryk, 2023). We have classified all Set1 and subunit interactors according to these SET1C roles (Fig. S5). We found a number of interactors involved in meiosis. In particular, Spp1 not only interacts with Mer2, but also with the meiosis specific DNA helicase Mer3 (Nakagawa & Kolodner, 2002) that interacts also with Swd1 (Fig. S5). We further found Set1 interactions with the kinetochore proteins Spc25 and Cbf2 suggesting that Set1 could be transiently localized at the spindle pole body. Regarding the biology of retrotransposons, we previously reported that Set1 binds post-transcriptionally to Ty1 mRNA and represses Ty1 mobility (Luciano et al, 2017). Interestingly, the two-hybrid screens reveal that Set1 1-754 interacted with Gag capsid-like proteins of Ty1 (Fig. S5) raising the possibility that Set1 binding to Ty1 mRNA is linked to the interaction of Set1 1-754 with Gag. Concerning the role of Set1 and subunits in DNA replication and repair, we report multiple potential interactions (Fig. S5). In particular, Swd2, Swd1, and Spp1interacted with high confidence with Orc6, Nrm1, and Mcm2, respectively (Fig. 1 and Fig. S5). Orc2 was previously described to interact physically with Spp1 (Kan et al, 2008). We recently reported that Spp1 is recruited at replication forks stalled at the Tus/Ter barrier independently of its interaction with Set1 (Ghaddar et al, 2023). Interestingly, in the Y2H screen Spp1 interacted with the extreme C-terminal region of Mcm2 (791-867) (Fig. S6A) that corresponds to a non-conserved accessible alpha-helix within the MCM complex (Li et al, 2015b). We fused Spp1 and Mcm2 to GST and performed GST pull-down experiments. We confirmed in vitro in both directions a weak interaction between Spp1 and Mcm2 (Fig. S6B). Whether Spp1 is recruited by Mcm2 at stalled replication fork remains to be determined. On its side Nrm1 inactivates MBF, a major regulator of the G1/S transcription (de Bruin et al, 2006). During replication stress, Nrm1 phosphorylation by the checkpoint kinase prevents its binding to MBF target promoters leading to the activation of G1/S transcription (Travesa et al, 2012). An exciting idea is that Swd1 recruits Nrm1 to stalled forks by promoting its phosphorylation by Rad53. Swd1 would play a role in linking replication stress and transcriptional regulation via Nrm1. Of note, Nrm1 was identified as a gene required for the cell-cycle pattern of H3K79me2 during early S phase (Schulze et al, 2009). The interaction between Swd1 and Nrm1 is described in more detail below.Finally, Y2H screening indicated that Set1 and its subunits interacted with a number of proteins involved in protein SUMOylation (Fig. S5). The proteins were either involved in SUMO conjugation or SUMO-dependent degradation. Remarkably, the C-terminus of Nis1 (360-407) that contains a potential SUMO-binding site (Hannich et al, 2005) was identified a high-confidence interactor of Spp1, Shg1, and Sdc1 (Fig. 1). Nis1 is localized at the bud neck (Iwase & Toh-e, 2001) at the vicinity of the septin collar containing several highly SUMOylated proteins (Shs1, Cdc11) (Wykoff & O’Shea, 2005) and has been implicated in preventing bud recovery at the site of division (Meitinger et al, 2014). We thus sought to confirm biochemically the interaction of Nis1 with the three SET1C subunits. We fused the GST to Spp1, Sdc1, and Sgh1 to perform pull-down experiments with in vitro translated Nis1. We confirmed the interaction of Nis1 with Spp1, and Sdc1, but not with Sgh1 (Fig. S7). However, mass spectrometry analyses on TAP-Nis1 did not reveal the presence of SET1C subunits (Table S3) suggesting that interaction between Nis1 and Spp1/Sdc1 might be transient. The relevance of the Nis1 and other putative interactors remains unclear, especially as many of those proteins are not known to be located in the nucleus. Interestingly, Nis1 has been reported to shuttle from the bud neck to the nucleus when overexpressed (Perez & Thorner, 2019). In Fig. S8, we have identified a number of interactors, including Sdc1 and Spp1, showing changes in localization following hypoxia (Henke et al, 2011). Of note, one of the two human SET1C homolog SET1B has a cytoplasmic location with functions unrelated to H3K4 methylation (Wang et al, 2017). Combined, these observations raise the question of the minor or transient localization of Set1 and its subunits outside the nucleus, or conversely of the transient localization of interactors within the nucleus.Set1 is SUMOylatedGlobal analyses of SUMOylated proteins in fission yeast revealed that Set1 and Spf1 (Spp1) were SUMOylated (Shin et al, 2005; Nie et al, 2015). As Set1 had two-hybrid interactions with Slx5 and Wss1, both of which act on SUMOylated proteins as they undergo protein degradation (Mullen et al, 2010), we tested whether Set1 can be SUMOylated. Cells expressing Myc-Set1 (Dehe et al, 2006) or transformed with pPB66-SET1 expressing GBD-Set1-FL (GAL4 binding domain) were transformed with a plasmid encoding His6-SUMO or a control plasmid. Proteins were purified on Ni-NTA agarose beads and detected by Western blot either using anti-MYC or anti-GAL4 antibodies. The results revealed that Set1 can be mono-SUMOylated (Fig. 6A) or di-SUMOylated (Fig. 6B). This difference may be due to the fact that GBD-SET1-FL is under the control of the ADH promoter in plasmid pGB66 and thus overexpressed.Figure 6.Set1 is SUMOylated.6His-SUMO–conjugated proteins were purified from cells transformed (+) or not transformed (−) with a plasmid encoding 6His-SUMO under control of the CUP1 promoter. Cell lysates (Input) and Ni-purified material (Elutes) were analyzed by Western blotting with an anti-MYC antibody (A) or and anti-GAL4 antibody (B-D). Analysis of 6His-SUMO -conjugated forms of (A) genomically MYC-tagged Set1 or (B) GB-Set1 transformed cells was performed (left panels), in both the cases SUMO expression and efficiency of purification were controlled using an anti-SUMO antibody (right panels). C) SUMOylation analysis of Set1 fragment F3+F4 (aa. 351-956) WT and the K769R mutant. D) SUMOylation analysis of Set1 fragment F5 (aa. 956-1080) WT, single mutants K1055R and K1060R, and the double mutant K1055R/K1060R mutant.We sought to refine the SUMOylated Set1 region. We transformed the plasmid encoding His6-SUMO and the control plasmid into cells expressing Set1 fragments F1, F2, F3, F4, F3+F4, and F5 (Fig. S9A). We expressed F3+F4 instead of the isolated F3 and F4 fragments in order to preserve the K769-centered motif predicted to be highly SUMOylated (Fig. S9B). F1, F2, F3, and F4 were not SUMOylated (not shown) while the F3+F4 fragment was clearly SUMOylated (Fig. 6C). In order to identify whether K769 is important for F3+F4 SUMOylation, we mutated K769 to R. We show that introduction of K769R into F3+F4 abolishes its SUMOylation (Fig. 6C), indicating that K769 is likely to be the SUMOylated lysine within the F3+F4 fragment. We then found that F5 was also SUMOylated (Fig. 6D). In this case, the substitution K1055R, K1060R, or the double substitution, does not affect the SUMOylation of F5 indicating that this motif also predicted to be SUMOylated with a high score is not the SUMOylated motif (Fig. 6D). Taken together, these experiments indicate that Set1 can be SUMOylated in the N-SET and SET domains, in the interaction region of Spp1 and Swd1-Swd2-Bre2-Sdc1, respectively. This raises the possibility that SUMOylation regulates the interaction of Set1 with its subunits, in particular with Spp1, which interacts dynamically with SET1C (Ghaddar et al, 2023; D’Urso et al, 2016; Karányi et al, 2018; Serra-Cardona et al, 2022). Interestingly, in mammals, the SUMO peptidase SENP3 (the ortholog of Ulp1 in budding yeast) interacts with MLL1 and MLL2, catalyzing the deSUMOylation of RbBP5 (Swd1). This process regulates the association of specific subunits of MLL1/MLL2, such as menin and Ash2L (Bre2), with the DLX3 gene, which plays a role in osteogenic differentiation (Nayak et al, 2014).The transcriptional corepressor Nrm1 interacts with SET1CScreening with SWD1 yielded a total of forty clones, fourteen of which contained fragments of the NRM1/YNR009w gene, which encodes a basic protein of 249 amino-acids (Fig. 7A). Its amino-terminus carries a putative D-box motif that was found to destabilize the protein (de Bruin et al, 2006). The Y2H results furthermore delineated a central domain (amino-acids 58 to 195) mediating the interaction with Swd1. A sequence motif within this domain displays strong similarity to the amino-terminus of histone H3; lysine 118 within Nrm1 (Nrm1-K118) aligns with lysine 4 of histone H3, the substrate of SET1C. We refer to this sequence as H3K4-like domain. The similarity of the H3K4 like domain and the H3K4 modification site suggested that Nrm1 may represent a non-histone substrate for SET1C. To test this idea, we initially performed in vitro methylation experiments with partially purified SET1C, S-adenosyl (methyl-3H) methionine and peptide substrates. We found that a H3K4 peptide was efficiently methylated, but a peptide carrying a H3K4A substitution was not (Fig. 7B). Also, no methylation was observed with a peptide encompassing K118 of Nrm1. The possibility remained that this peptide lacked parts of Nrm1 that were required for methylation. For this purpose, we obtained recombinant protein where the N-terminus of Nrm1 was fused to the 42 kDa maltose binding protein (MBP). Interestingly, we observed in vitro methylation of this protein by SET1C but not with MBP only (Fig. 7C). Note, however, that histone methylation occurred much more efficiently under these reaction conditions. Next, we asked whether K116 and K118 of Nrm1 were required for the observed methylation activity. Fig. 7D shows that wild-type and mutant MBP-fusion proteins were found to be methylated suggesting that the H3K4-like domain is not required for the observed SET1C methylation activity.Figure 7.Nrm1 is methylated in vitro by SET1C.A) Schematic representation of the S. cerevisiae Nrm1 protein. Nrm1 carries a D-box sequence at its amino-terminus and a central domain that mediated interaction with the Swd1 subunit of SET1C in a yeast two-hybrid screen. A H3K4 like domain that closely resembles the modification site of SET1C in histone H3 is contained within the Swd1 interaction domain. Identical and similar amino-acid positions are shown in italic. Lysine 118 (K118) of Nrm1 aligns with lysine 4 of histone H3; also indicated are K116R and K118A mutant sequences. B) In vitro methylation reactions using partially purified SET1C, 3H-SAM and the indicated peptides. Radioactive reaction products retained on Whatman P81 filter paper following extensive washes were measured by scintillation counting. Each reaction was done in triplicate and error bars indicate the standard deviation. C) In vitro methylation reactions as in (B), however, core histone (2, 4 and 6 mg) and recombinant MBP and MBP-Nrm1 fusion protein (0.5, 1 and 2 mg) were tested as substrates for methylation. Reaction products were separated on 4 to 12% NuPAGE gels and analyzed by fluorography. D) In vitro methylation reactions as in (C), however, core histone (2 mg) and recombinant MBP-Nrm1 wild-type and K118A and K116R fusion protein (0.5, 1 and 2 mg) were tested as substrates for methylation. (upper panel). Note that the molecular mass marker proteins (MM) have been resolved together with the core histone methylation reaction in the same lane. The asterisk indicates migration of a non-specific background signal of unclear origin. The substrate proteins included in the reactions were analyzed on a parallel gel and stained with colloidal Coomassie G-250 (lower panel). E) H3K4-like proteins. Shown are selected proteins containing sequences similar to the modification site found in histone H3. An exhaustive list can be found in Table S4.The H3K4-like domain in Nrm1 raised our attention to other yeast proteins that carry such sequences. We used the scansite search algorithm (http://scansite.mit.edu) to systematically identify sequence motifs that are related to the SET1C modification site in histone H3. Search parameters included four to six identical residues of the ARTKQT sequence that is found at the H3K4 modification site. In addition, we did allow for biochemically equivalent amino acid changes. Fig. 7E shows eight candidate proteins based on their function and the sequence context of the H3K4-like domain. Importantly, some of these gene products are involved in cellular pathways that functionally overlap with SET1C, e.g. transcription (Not5), rDNA silencing (Irs4) and cell-cycle control (Dbf2 and Dbf20), increasing the possibility of occurring physical and functional interactions.SET1C Y2H interactors regulate metabolism and stress responsesSet1 was reported to regulate ergosterol levels (South et al, 2013). We identified Erg9, Ugt51, Vhr1, Vhr2 and Ste20, all involved in ergosterol metabolism (Daicho et al, 2020; Lees et al, 1995; Warnecke & Heinz, 1994). Erg9 and Ste20 interacted with Set1 while Ugt51 and Vhr1/Vhr2 were high confidence interactors of Shg1 and Sdc1, respectively (Fig. S10). Along the same line, the various Y2H screens revealed numerous genes involved in phosphatidyl inositol metabolism interacting with Set1 and its subunits. In particular Vip1 is a high-confidence interactor of Set1 754-1081 (Fig. 1B). Vip1 is a bifunctional inositol pyrophosphate kinase and phosphatase that regulates IP7 levels in the inositol pyrophosphate (PP-IP) synthesis pathway (Lee et al, 2007; Mulugu et al, 2007). Interestingly, Vip1 was reported to regulate the environmental stress response (ESR) through IP7 that activates the HDAC Rdp3 (Worley et al, 2013) suggesting potential new avenues to explain ESR regulation by Set1 (Weiner et al, 2012). Along the same line, Swd1 and Swd3 were identified in a screen aimed to identify genes that negatively regulate the PHO pathway in a Vip1-dependent manner (Choi et al, 2017). How the putative interaction between Set1 754-1081, which also interacts with Pho23 subunit of the Rpd3L complex, and Vip1 fits into these processes remains to be discovered. Of note, Vip1 has been shown in Arabidopsis thaliana to change localization upon hypo-osmotic stress from the cytosol to the nucleus (Takeo & Ito, 2017). On their side, Y2H Interactors identified as stress-responsive genes interact either with Set1 1-754 or Swd2 (Fig. S10). Swd2 interacted with high confidence with Nar1, an essential Fe/S protein required for the assembly of cytosolic Fe/S proteins (Balk et al, 2004) and the calcineurin phosphatase Cmp2 activated in response to ER stress (Mizuno et al, 2018). The Swd2/Nar1 interaction can be linked to the fact that Set1 754-1081 interacts with relatively good confidence with TyW1 according to hybrigenics criteria (see Methods), an iron-sulfur protein required for synthesis of wybutosine modified tRNA (Noma et al, 2006). In contrast to the stress genes mentioned above, many interactors involved in glucose metabolism (repression) interact only with the Set1 1-1081 or with members of the nSET module (Fig. S10).Reconstituted Set1C methylates the Snf2 RG motif within the AT-hook in vitroWe have shown above that SET1C interacts with Snf2C-AT-hook region (Figure 4). We thus tested whether the Snf2C-AT-hook could be methylated by Set1C. Set1C and truncated Set1C were reconstituted and affinity purified from Sf9 cells coinfected with baculoviruses that express FLAG-Set1 (or truncated Set1) and the seven other untagged subunits (Kim et al, 2013)(Fig. S3). We incubated reconstituted Set1C with the Snf2C, AT-hook and Bromo fragments in the presence of radioactive S-adenosylmethionine (3H-SAM). The results indicate that Set1C methylates in vitro purified Snf2C and Snf2C-AT-hook, but not Bromo (Fig. 8A, B) and that Snf2C-AT-hook methylation requires Set1 FL (Fig. 8C). Collectively these results show that the Snf2C-AT-hook (1384-1547) interacts and is methylated by Set1 FL in vitro. Lys 1494 (K1494) and Lys 1498 (K1498) located between the AT-hook domains of Snf2 were previously shown to be acetylated by Gcn5 (Kim et al, 2010). We individually mutated all the Lys of the Snf2-AT-hook into Arg and tested the methylation of the mutated fragments. null of the substitutions abolished or decreased the methylation of the AT-hook indicating that he AT-hook could be methylated on multiple sites or on other type of residues (Fig. S11). We thus sought to identify the minimal region within the Snf2-AT-hook that is methylated by Set1C in vitro. The Snf2-AT-hook domain was divided in 6 regions that were fused to the GST (Fig. 8D). In vitro methylation assays indicated that the Snf2-B1, B2, B3 were methylated by the reconstituted Set1C (Fig. 8E). As the Snf2-B3 fragment that contains the last four lysines (K1488, K1494, K1498, K1526) of Snf2-AT-hook domain was still methylated, it suggested that one of several of these lysines are methylated by Set1C. We then examined which of these 4 lysine residues are methylated by Set1C in vitro. To our surprise, mutating all the lysine residues of the Snf3-B3 fragment did not abolish the methylation of Snf3-B3 (Fig. 8F). These results led us to think that Set1C could methylate arginine residues, in particular those contained in the RGG motif of the Snf2-B3 fragment. We thus deleted the RG repeats of Snf2-B3 (Fig. 8G) and purified the Snf2-B3ΔRG. We found that deletion of the Snf2-B3 RG repeats abolished the interaction between Snf2-B3 and Set1 and methylation of Snf2-B3 (Fig. 8H, I). The fact that both, interaction and methylation are lost upon deletion of the RG motif argues in favor that Set1C, and not a potential contaminant from the reconstituted Set1C, is responsible for the methylation of the Snf2-B3 RG repeats. Individual deletion of pairs of arginine residues in the RG motif did not suppress methylation of the Snf2-B3 fragment, suggesting flexibility in Set1C’s ability to methylate Snf2-B3 (Fig. S12).Figure 8.Snf2 is methylated in tandem AT-hook domain by reconstituted Set1C.A) In vitro methyltransferase assay using purified SET1C and Snf2 fragments. H-SAM was used as a methyl-donor and methylated proteins were detected by autoradiography. The band marked with a red star is a degradation product of Snf2C. B) In vitro methyltransferase assay using SET1C and two Snf2-AT-hook fragments with two different tags. C) Schematic diagram of N-terminal truncated SET1 complexes (left) and in vitro methyltransferase assay with GST-Snf2-AT-hook and truncated SET1 complexes. D) Schematic diagram showing the positions of all lysines in Snf2-AT-hook and the further cleaved fragments of Snf2-AT-hook. The red box indicates the two lysines that are acetylated by Gcn5. E) Coomassie staining of purified Snf2 fragments (lower) and an in vitro methyltransferase assay using these fragments with SET1C (upper). F) In vitro methyltransferase assay by SET1C when each of the four lysines in the C-terminal region of the Snf2-AT-hook is substituted with arginine or when both lysines known to be acetylated by Gcn5 are substituted. G) A schematic diagram showing the position of the RG-repeat region and the design of Snf2-AT-hook with RG-repeat truncation. H and I) GST pull-down assay (H) and in vitro methyltransferase assay (I) using purified SET1C and GST-Snf2-AT-hook with or without RG-repeats.To further confirm that Snf2-B3 is methylated on arginine, we incubated a mutant Snf2-B3 (in which lysines were mutated in alanine to limit protease digestion prior mass spectroscopy analysis) with reconstituted Set1C and SAM and further purified the Snf2-B3 mutant on a Ni-NTA resin (Fig. 9A-D). We then analyzed by mass spectroscopy arginine methylation in Snf2-B3. We found that R1490, R1501, R1505, R1507 and R1517 were mono- and di-methylated while R1509, R1513, and R1519 were monomethylated (Fig. 9E). We thus confirmed that reconstituted Set1C has the ability to methylate in vitro multiple arginines in the Snf2B3 region.Figure 9.The arginines in the RG-repeat of Snf2 are methylated by reconstituted SET1C.A) A diagram showing the WT Snf2-B3 fragment and the Mut Snf2-B3 with all four lysines substituted with alanine. B) Coomassie staining of purified WT and Mut Snf2-B3. C) Mass-spectrometry experiment design to identify the methylation sites of Snf2-B3. D) Coomassie staining of Mut Snf2-B3 after methylation reaction and an additional purification step using Ni-NTA. The band corresponding to Mut Snf2-B3 (∼18 KDa) was excised and used for mass spectrometry analysis. The ∼37 KDa band observed in lanes 5–8 appears to be a SET1C subunit that binds non-specifically to Ni-NTA, likely SWD2 based on its size. E) Mass spectrometry analysis result of Snf2-B3 methylation sites revealed that multiple arginines in the RG-repeat were methylated. Amino acid sequence of Snf2 highlighting the arginines methylated by SET1. The sequence of the B3 fragment is shown in bold, and the arginines methylated by SET1 are marked in red. Methylation and demethylation are denoted as M and DM, respectively.Snf2 is methylated in vivo on its ARTSTRGR AT-hook motif in a Set1-dependent wayOur results show that an activity associated with reconstituted Set1C is capable of methylating arginines in the vicinity and in the RG repeats of Snf2C-AT-hook. The fact that only Set1FL is capable of methylating the AT-hook is in favor of this activity being associated with Set1C. Nevertheless, one cannot formally rule out that methylation the AT-hook is due to a contaminant from insect cells from which Set1C has been reconstituted.We thus investigated the interaction between Snf2 and Set1 in vivo and whether Snf2 is methylated by Set1C. We found that Set1 was coimmunoprecipitated with Snf2 tagged with a C-terminal Myc epitope (Fig. 10A). In contrast to what we observed in vitro, deletion of the RG motif of Snf2 did not affect the interaction between Snf2 and Set1, which is consistent with the fact that the SID of Snf2 is located upstream of the RG repeats (Fig. 10A).Figure 10.The arginines of the motif ARTSTRGR within the AT hook are methylated in vivo in a Set1-dependent way.A) Set1 interacts in vivo with Snf2 and Snf2-ΔRG. Myc-tagged Snf2 and Snf2ΔRG were immunoprecipitated with 9E10 Myc antibodies (see Methods) and revealed with either 9E10 (Upper panel) or Set1 antibodies (lower panel). B) Snf2C complex was purified from WT and set1Δ strains, separated on a 4-12% Bis-Tris Gel and Silver Stained (Left); the presence of Snf2-GFP is detected by Western-blotting with anti-GFP antibody (Right). The area corresponding to Snf2-GFP was excised from the gel and used for mass spectrometry analysis. Peptides flanking the RG repeats (1485-1549) with their PTM are shown in Fig. S14. C) Panel C show a focus on the amino sequence flanking the RG repeats. The positions of residues from D1485 to V1549 are indicated on the figure. Peptides identified after digestion of Snf2-GFP are indicated in color with their identified PTM indicated by the color code shown in the top of the panel. The small numbers above the amino acids indicate the probability of localisation according to the MS2 peaks. It should be noted that for wild-type K1488 and R1490, a peptide with dimethylation is detected, but no discriminating MS2 peak allows us to conclude whether K or R are dimethylated. This is also the case for dimethylation on R1528 and R1535. The results presented represent the observed PTMs from two independent experiments, each containing 3 replicates (Table S6).To further investigate Snf2 methylation by Set1C in vivo, we purified Snf2-GFP and its subunits with GFP nanobodies in the presence or absence of Set1 (Fig. 10B). The protein composition of the complex was determined by mass spectrometry in the presence of absence of Set1 (Figure 10B, Table S5). We recovered in both cases all the known components of the Snf2 complex (Snf2, Swi1, Swi3, Snf5, Snf12, Swp82, Arp9, Arp7, Snf6, Rtt102, Snf11, Taf14) (Table S5, Fig. S13A). Interestingly, we found that the arginine methyltransferase Rmt2 was found specifically enriched with the Snf2-GFP complex in set1Δ cells (Fig. S13).We then excised the Snf2-GFP gel band and subjected it to mass spectrometry. We examine the post-translational modifications (PTM) in the Snf2 (1485-1549) region in either WT or set1Δ strains (Table S6). We were unable to purify a peptide containing the RG repeats but we could identify the peptides flanking the RG motif (Fig. 10C). Fig. 10C represents the combined results of two independent experiments. In WT cells, we found that the region between K1494 and R1505 was reproducibly subjected to multiple PTM (Fig. 10C, upper panel). K1494 and K1498 that were previously found acetylated by Gcn5 (Kim et al, 2010) were found acetylated, however both lysines were also found to be methylated (Fig. 10 C). Of note H3K4 that is methylated by Set1C has been reported to be also acetylated by Gcn5 (Guillemette et al, 2011). T1995, S1996, S1999, T1502, S1503, and T1504 were found phosphorylated. Interestingly, R1501 was found mono-methylated while R1505 and R1507 were found di-methylated in the two independent Snf2-GFP purifications. These 3 arginines belong to a ARTSTRGR motif that lies in the Snf2-B3 fragment. They were also found to be methylated in vitro by the reconstituted Set1C (Fig. 9E). We then examine the posttranslational modifications of the peptides flanking the RG motif in the set1Δ strain (Fig. 10C, lower panel). Phosphorylation of serines and threonines was not modified in the set1Δ strain except for T1502. In the set1Δ strain, K1494 and K1498 remained methylated indicating that methylation of both lysines does not depend on Set1C. Strikingly, deleting SET1 abolished the mono-methylation of R1501 and the di-methylation of R1505, R1507 (Fig. 10C, lower panel). The results thus show that SET1C is required for the methylation of the three arginines of the ARTSTRGR motif, in agreement with the in vitro results.DiscussionWe have exploited the power of Y2H screening technology to establish an extended interaction network for the histone H3K4 methylase complex SET1C. Comprehensive data integration unveiled many potential functions of either the whole complex or individual subunits. This study is partly validated by the fact that we found interactors in known functions of SET1C, or putative functions for which the mechanism is unknown. We have also provided a number of validations by confirming the interaction through biochemical approaches. It seems likely that some proteins interact transiently with Set1 and its subunits, or under specific conditions of stress or nutrient limitations, explaining why these interactors have not previously been found associated with SET1C in biochemical approaches. The most illustrative case for this is the high-affinity interaction between Spp1 and Mer2 that takes place during the first meiotic division, which we had identified from the Spp1 screen and which has been extensively characterized (Acquaviva et al, 2013b). Nevertheless, considering the multitude of interactions identified, it seems unlikely that they all represent direct contacts, especially where multiple subunits of complexes or multiple components of a given metabolic pathways interact with Set1C. One caveat is that Y2H interactions can be mediated by endogenous proteins that bridge the interactions. But this does not make them less functionally significant. We anticipate that this systematic screen will be an invaluable resource for further investigation of the role of SET1C in known and novel processes revealed in this study. Processes discussed here include Set1’s export/import mechanism through the nucleus, interaction with RGG proteins some of which are targeted by arginine methyltransferase, cooperation of SET1C with chromatin remodeling factors in particular Snf2C, interaction with splicing factors notably with Prp8 and Prp22, coupling replication with histone deposition (Mcm2/Spp1), SET1C plasticity regulated by SUMOylation, and Ty element transposition. A recurrent question related to the identification of potential SET1C interactors is whether they could be methylated by SET1C. Based on the identification of domains that closely resembles the histone H3 modification site, we have shown that the Swd1 interactor Nrm1 is methylated by SET1C in vitro suggesting that proteins with H3K4-like domains represent a class of non-histone substrates that may be regulated by SET1C.We show that Set1C interacts both in vitro and in vivo with Snf2. Strikingly, reconstituted Set1C from insect cells is able to methylate in vitro the three arginines located within the ARTSTRGR motif of the AT-hook of Snf2. The in vivo results confirm that Set1 is required for the methylation of these arginines within the ARTSTRGR motif. It is interesting to note that this motif resembles the ARTKQTAR motif of the N-terminal H3. In yeast, H3R2 is mono- and di-methylated and its asymmetric di-methylation prevents H3K4me3 (Kirmizis et al, 2009, 2007) . In contrast symmetric di-methylation of H3R2 correlates with H3K4me3 and requires Set1 in vivo but not the classical arginine methyltransferases: Hmt1, Hmt2, Rkm2, Rkm3, Rkm4, Hsl7, and Efm1 (Li et al, 2015a; Yuan et al, 2012). It has been proposed that Set1C could be responsible for both H3R2me2s and H3K4me3 or that H3R2me2s deposited by a yet unidentified arginine methyltransferase requires the prior deposition of H3K4me3 (Yuan et al, 2012).Interestingly, previous tandem affinity protein purification of the mono- and asymmetric arginine methyltransferase Hmt1 (also termed Rmt1) identified 108 proteins associated with it (Jackson et al, 2012), a number of which were shown to be methylated. Snf2 was found to be copurified with Hmt1 in vivo and methylated in vitro by Hmt1 (Jackson et al, 2012) making Hmt1 a potential candidate for methylating Snf2. In vitro, purified Hmt1 catalyzes mono-methylation and asymmetric di-methylation of H3R2, however, deleting HMT1 does not affect the asymmetric di-methylation of H3R2 in vivo, which suggests that several methyltransferases could act redundantly on H3R2 (Li et al, 2015a). In mammals, H3R2 and H3R8 are asymmetrically di-methylated by PRMT6 (Hamey et al, 2021; Guccione et al, 2007; Hyllus et al, 2007). It has been also reported that PRMT5 can be found associated with hSWI/SNF and has the ability to methylate H3R8 (Pal et al, 2004). We did not identify Rmt1 in our purification but found that the arginine mono-methyl transferase Rmt2 enriched with Snf2-GFP in set1Δ cells. Rmt2 is a type IV methyl transferase that was reported to methylate the ribosomal protein L12 (Low & Wilkins, 2012; Chern et al, 2002). We could envision the possibility the possibility that Set1C could cooperate with distinct protein arginine methyl transferases to promote the mono-methylation of R1501 and the di-methylation R1505 and R1507 within the ARTSTRGR motif. However, it was previously reported that the combined inactivation of Rmt1, Rmt2 and Hsl7 did not affect the mono-methylation of H3R2, weakening this hypothesis (Kirmizis et al, 2009). It is possible that in yeast there is a redundancy of enzymes capable of methylating the Snf2 ARTSTRGR motif, but that for each of them their activity on this motif depends on the presence of Set1. Alternatively, Set1C could directly methylate the ARTSTRGR motif as discussed for the ARTKQTAR H3 motif (Yuan et al, 2012). The fact that Set1C interacts with Snf2, Gbp2, Nop1, Nab2, Dbb1 (Fig. 2), all of which have RG motifs and are mostly Hmt1 substrates, raises the possibility of a general interplay between methylarginine and methyllysine.Interestingly, a very recent article shows that PRMT1 binds to the N-terminal region of MLL2 and methylates multiple arginine residues within its RGG/RG motifs (An et al, 2025).Materials and methodsStrain constructionAll strains and plasmids used in this study are listed in Table S1. To obtain gene deletions and expression of tagged proteins, we amplified by PCR a disruption or a tagging cassette containing the appropriate marker as described (Janke et al, 2004).Yeast two-hybrid analysisYeast two-hybrid screening was performed by Hybrigenics Services, S.A.S., Evry, France (73). The coding sequence for Set1-FL, Set1 1-754, Set1 754-1081 and Bre2 were cloned into pB66 (GAL4-bait) as C-terminal fusions to the Gal4 DNA-binding domain while those of Swd1, Swd3, Sdc1, Spp1, and Shg1 were cloned into pB27 as a C-terminal fusion to LexA (LEXA-bait). SWD2 was cloned into pB43 as a N-terminal fusion (SWD2-GAL4). Individual bait cloning was performed by using specific primers for PCR for every bait. Every PCR fragment subcloned as bait is entirely sequenced to avoid eventual mismatches in the coding sequence. The constructs were used as baits to screen a genomic S. cerevisiae library constructed into pP6 based on the pGADGH plasmid (Wilson et al, 1993). pB6, pB66 and pB43 are derived from the original pAS2Δ vector (Fromont-Racine et al, 1997). The library was submitted to very strict quality controls. Each protein is represented by several fragments (domains) and the library has been screened with a set of 6 reference baits before any other bait proteins are screened.The Gal4 constructs were screened using a mating approach with YHGX13 (Y187 ade2-101::loxP-kanMX-loxP, MATalpha) and CG1945 (MATa) yeast strains. The LexA constructs were screened using a mating approach with YHGX13 (Y187 ade2-101::loxP-kanMX-loxP, mat alpha) and L40ΔGal4 (MATa) yeast strains as previously described (Fromont-Racine et al, 1997). Positive clones were selected on a medium lacking tryptophan, leucine and histidine and supplemented with 3-aminotriazole (3AT) if necessary to handle bait auto-activation. The prey fragments of the positive clones were amplified by PCR and sequenced at their 5’ and 3’ junctions. The resulting sequences were used to identify the corresponding interacting proteins in the GenBank database (NCBI) using a fully automated procedure.A confidence score (PBS, for Predicted Biological Score) was attributed to each interaction as previously described (Formstecher et al, 2005). The confidence score relies on two different levels of analysis. Firstly, a local score takes into account the redundancy and independency of prey fragments, as well as the distribution of reading frames and stop codons in overlapping fragments. Secondly, a global score takes into account the interactions found in all the screens performed at Hybrigenics using the same library. This global score represents the probability of an interaction being nonspecific. For practical use, the scores were divided into four categories, from A (highest confidence) to D (lowest confidence). A fifth category (E) specifically flags interactions involving highly connected prey domains previously found several times in screens performed on libraries derived from the same organism. Finally, several of these highly connected domains have been confirmed as false-positives of the technique. The PBS scores have been shown to positively correlate with the biological significance of interactions. When possible, the bait interacting domain of each prey is provided. The PBS scores have been shown to positively correlate with the biological significance of interactions (Rain et al, 2001). e-values for the interactions are available in the Hybrigenics database.Protein expression and protein interaction assaysProtein expression was done in Escherichia coli BL21 cells and purification of GST-fusion proteins were as described (Dichtl et al, 2002). MBP-fusion proteins were purified according to manufacturer’s instructions (New England BioLabs, Beverly, MA, USA). For His-tagged proteins expressed in bacteria, cDNAs were inserted into the pET28 vector (Novagen), expressed in Escherichia coli, and purified using Ni-NTA beads (Qiagen) following the previously described procedure (Kim & Roeder, 2011). GST pull-down assays were done as described (Dichtl et al, 2002).A baculovirus expression system was used to express and reconstitute Set1 complexes containing either FLAG-Set1 or FLAG-Set1-C762. cDNAs were subcloned into pFASTBAC1, with or without an epitope tag, and baculoviruses were produced following the manufacturer’s instructions (Gibco-Invitrogen). Sf9 cells were infected with various combinations of baculoviruses, and the complexes were purified by affinity chromatography using M2 agarose, as previously described (Kim & Roeder, 2011).TAP-Nis1 affinity purification and mass spectrometry analysisTAP-Nis1 and control cells (W303a) were grown in YPD, harvested in logarithmic phase (OD600 0.6-0.85) and cryo-lysed as previously described (Trahan & Oeffinger, 2022). Affinity purification was performed in RNP100 (20 mM HEPES-KOH pH 7.4, 100 mM NH4OAc, 0.5% Triton X-100, 0.1% Tween 20, 1:100 solution P, 1:5000 antifoam A, 100 mM NaCl) as described in (Trahan & Oeffinger, 2022). Following washes, the samples were on-bead trypsin digested in a volume of 50µl (f. c. 20 μg/mL trypsin (Sigma, proteomics grade) in 20 mM Tris-HCl (pH 8.0), 37 °C, 900 rpm, 16-20 h; stopped with 2% formic acid) and analyzed by tandem mass spectrometry as described in (Trahan & Oeffinger, 2022) using a 70-minute gradient on a LTQ Orbitrap Velos is a hybrid mass spectrometer (ThermoFisher Scientific) in Data-dependent mode. Data were processed with Thermo Excalibur to generate a raw file. Mascot search server (53 Version 2.3.02) was used with a parent tolerance of 10 ppm for precursor ions, 0.52Da for fragments, and only considering 1 possible missed cleavage as well as a mass change of +16 for methionine oxidations in the mass calculation. Data were searched against S. cerevisiae NCBI database and analyzed in Scaffold (version 3.6.4). The threshold and false discovery rates (FDR) were set to 80% and 0.37% respectively for peptides, and to 95% (1 peptide minimum) and 1.9% for respectively for proteins. Exclusive spectrum counts (ESC) were used for analysis and for each prey, the highest values obtained in the controls were removed from those of the samples during analysis.In vitro methylationIn vitro methylation reactions were done essentially as described (Roguev et al, 2001). 30 ml reactions typically contained 2 to 4 ml of partially purified SET1C complex, 2 to 4 mg substrate (either peptide, or core histone mixture, or recombinant H3) and 2 ml S-adenosyl (methyl-3H) methionine in MTA buffer (50 mM Tris 8.5, 20 mM KCl, 10 mM MgCl2, 250 mM sucrose). Reactions with core histones and recombinant H3 were resolved on 4-20% NuPAGE gels and subjected to fluorography. For Snf2 methylation assays, reaction mixtures containing purified SET1C (with 30 ng of the Bre2 subunit) and 200 ng of Snf2 fragments in 20 μl of reaction buffer (25 mM HEPES [pH 7.6], 50 mM KCl, 5 mM MgCl2, 0.1 mM EDTA, and 10% glycerol) were supplemented with 1 μCi of S-adenosyl (methyl-3H) methionine (PerkinElmer) and incubated at 30°C for 1 hour. Proteins were resolved by SDS-PAGE and subjected to fluorography. For fluorography, gels were fixed for 30 min in 40% methanol, 10% acetic acid, treated with EN3HANCE solution (Perkin Elmer) for 60 min, washed in cold dH20 for 30 min, dried and exposed for five to fourteen days to photographic film.Mass spectrometry-based identification of Arg methylation in Snf2-B3Mutant Snf2-B3 underwent a methylation reaction with SET1C and SAM, followed by purification via Ni-NTA affinity chromatography and separation by SDS-PAGE. The gel bands corresponding to the mutant Snf2-B3 were excised and subjected to in-gel digestion with AspN enzyme, followed by peptide extraction. The resulting peptide fractions were analyzed using an Easy-nLC 1200 coupled to an Orbitrap Fusion Lumos mass spectrometer (Thermo Fisher Scientific, MA, USA) at the Korea Basic Science Institute (Ochang). Peptides were separated on a C18 column using a 150-minute gradient, and data were acquired in data-dependent acquisition (DDA) mode. Full MS scans were acquired in the Orbitrap at a resolution of 60,000 over an m/z range of 350–2,000. Precursors for MS/MS analysis were selected for higher-energy collisional dissociation (HCD) fragmentation at a normalized collision energy of 30%. Raw MS data were processed using Proteome Discoverer with the SEQUEST search engine. The data were searched against the sequence of Snf2-B3 with a precursor mass tolerance of 10 ppm and a fragment mass tolerance of 0.02 Da. AspN was set as the digestion enzyme, allowing for up to two missed cleavages. Methylation, dimethylation, and methionine oxidation were specified as variable modifications. The false discovery rate (FDR) was set to 1% at the peptide level.Y2H interaction of Set1 fragments with selected preysThe Set1 fragments were amplified from the pB66-Set1-FL plasmid and cloned into the SfiI site of pB66. The selected preys (Snf2, Prp8, and Prp22) into p6 (Hybrigenics) were extracted from the screen. Plasmid pB66 contains the Gal4 DNA binding domain and the TRP1 marker while pP6 expresses the Gal4 activating domain and the LEU2 marker. TOTO cells were transformed with the different pB66-Set1-Fragments and the pP6-interactors and incubated 3 days at 30°C on SD-LEU-TRP. The transformant colonies were then streaked on SD-LEU-TRP-HIS containing either 5 mM or 20 mM of 3AT. To visualize interaction between Set1 fragments and the interactors, yeast cells were incubated 2 days at 30°C and cell growth was examined.CO-IP of Prp22-FLAG with Myc-Set1Co-immunoprecipitation experiment was performed in W303 expressing chromosomally encoded Myc-Set1 (Dehe et al, 2006) and Prp22AID-FLAG (Mendoza-Ochoa et al, 2019). 250 ml of culture at an OD600 of 0.8 was harvested by centrifugation at 1000 x g and washed twice in ice-cold 1 X PBS. The cell pellet was re-suspended in 900 µl lysis buffer (50 mM Tris-HCl pH 7.5, 2 mM Mg2Cl2, 150 mM NaCl, 0.2% NP-40 and one complete EDTA-free proteinase inhibitor tablet (Roche #11836145001) and 400 µl zirconia beads. Cells were lysed using a Mini-Beadbeater-24 (BioSpec Products) twice at 2000 rpm for 2 min followed by 2 min on ice. The sample was centrifuged at 1000 x g for 2 min, the supernatant was collected and additionally centrifuged at 20,000 x g for 30 min at 4℃ and used for immunoprecipitation. The concentration of protein was measured using the Bradford assay, and 1 mg of protein used per IP. Prior to immunoprecipitation, extract was pre-cleared by adding ½ volume unconjugated Protein A/G Dynabeads (Life Technologies ##10001D/10003D). 50 µl Protein A/G Dynabeads conjugated to antibody were incubated with the appropriate volume of extract on a rotating wheel overnight at 4℃. The next day, beads were washed 8 times in lysis buffer (non-bound fraction kept for analysis). 20 µl of loading buffer was added to the beads, input and non-bound samples, which were boiled for 10 min before loading on a NuPAGE 4-12% Bis-Tris gel Bis-Tris (Invitrogen) and western blotting was performed.Set1 SUMOylation analysisCells were transformed with a plasmid encoding 6His-SUMO under the CUP1 promoter (YEp352-6His-SUMO) or the corresponding empty vector (Niño et al, 2016). The transformed cells were grown on selective medium and stimulated overnight with 0.1 mM CuSO4. 200 OD600 of cells were collected and lysed with glass beads in a 20% TCA solution, the final TCA concentration was adjusted to 12%. Cell lysates were incubated at 4°C during 45 min, and precipitated proteins were collected by centrifugation. Proteins were resuspended in loading buffer (6 M guanidinium-HCl, 100 mM KH2PO4, 20 mM Tris-HCl, pH 8,0, 100 mM NaCl, 0,1% Triton X-100, and 10 mM imidazole). 6His-SUMOylated proteins were purified using Ni-NTA agarose beads (Qiagen), pre-equilibrated with loading buffer, and incubated for 1 h at room temperature. After incubation the beads were collected by centrifugation (3000 rpm, 2min) and washed twice with wash buffer (8 M urea, 100 mM Na2HPO4/NaH2PO4 pH 6,4, 10 mM Tris–HCl, pH 6.4, 10 mM Imidazole, 10 mM β-mercaptoethanol, and 0.1% Triton X-100). 6His-SUMOylated proteins were eluted with 50 ml 2X laemmli buffer (95°C, 5min). The proteins in the eluted fraction were analyzed by Western blot using anti-MYC (for endogenous Myc-Set1), anti-GAL4 (for GBD-Set1-full length and fragments) and polyclonal rabbit anti-Smt3.Interaction Snf2-AT-hook with SET1C and SET1C-762GST-tagged Snf2 fragments (final concentration 250 nM) were combined with either the full-length SET1C or C762SET1C (final concentration 25 nM), along with 15 µl of glutathione-Sepharose 4B resin and BSA (final concentration 0.2 mg/ml) in a binding buffer containing 20 mM Tris-Cl (pH 7.9), 150 mM NaCl, 0.2 mM EDTA, 20% glycerol, 0.1% NP-40, and 1 mM PMSF, making a total volume of 300 µl. The mixtures were rotated at 4°C for 3 hours, followed by four washes with the binding buffer. The proteins bound to the resin were then eluted, separated by SDS-PAGE, and analyzed by immunoblotting.CO-IP of Snf2-Myc and Snf2ΔRG-Myc with Set1WT cells or expressing Snf2-Myc and Snf2ΔRG-Myc (200 ml) were grown at 30°C in YPD to and O.D600 = 0.8. Cells were collected by centrifugation, washed once with 10 mM Tris-HCL, pH 8.0 and snap-frozen in liquid nitrogen. Cells were lysed using Retsch with the following parameters :2 times 2 min at 30 m/S. The powder was resuspended in 3 ml of TMG 50 (10 mM Tris-HCL, pH 8.0, 0,1 mM MgCl2, 10% (V/V) glycerol, 50 mM NaCl, 0.1 mM EDTA, 0.1 mM DTT) containing protease inhibitors, 10 mM MG-132 and 1 mM PMSF. Cell lysates were clarified by centrifugation (13 300 rpm, 15’, 4°C) and 1.4 ml of supernatant were recovered. Protein concentration was determined using nanodrop and samples were adjusted to the same concentration by adding lysis buffer. Immunoprecipitation was performed overnight with 5 ml of 9E10 antibody (Santa Cruz Biotechnology) following by an incubation for 3 hours with 25 ml of pre-equilibrated protein-G dynabeads (Invitrogen). Immunoprecipitations were washed 3X with TMG 50 buffer and eluted using 25 ml of 1X Laemmli loading Buffer. Samples were resolved on a 7.5% Acrylamide gel, transferred on a nitrocellulose membrane and reveal with either anti-Myc 9E10 (Santa Cruz Biotechnology) and anti-Set1 antibodies.Snf2-GFP Complex purification800 ml of Snf2-GFP and Snf2-GFP set1Δ cells were grown at 30°C in YPD to O.D600 = 0.8. Cell pellets were treated as described above except that supernatants were incubated with 25 ml of GFP nanobody coated Dynabeads (Gift from M. Modesti, CRCM Marseille) for 250 min, wash 3X with TMG 50 buffer and eluted in 30 ml of 2X Laemmli Loading buffer containing 50 mM DTT. For Western blotting, 1 ml was resolved on a NuPAGE 4-12% Bis-Tris Gel (Invitrogen), transferred on a nitrocellulose membrane and revealed using an anti-GFP antibody (A-11122-Invitrogen). For the Silver Staining, 2,5 ml were resolved on a NuPAGE 4-12% Bis-Tris Gel (Invitrogen) and stained using PierceTM Silver Stain kit (Thermo Scientific).Mass spectrometry-based identification of post-translational modifications in Snf2-GFPPurified Snf2-GFP (n=3, biological replicates) from WT and set1Δ strains were loaded on NuPAGE™ 4–12% Bis–tris acrylamide gels according to the manufacturer’s instructions (Life Technologies). Running of protein was stopped as soon as proteins stacked in a single band. Protein containing bands were stained with Imperial Blue (Pierce), cut from the gel and digested with high sequencing grade trypsin (Promega) before mass spectrometry analysis. Briefly, gel pieces were washed and destained using few steps of 100 mM NH4HCO3. Destained gel pieces were shrunk with 100 mM ammonium bicarbonate in 50% acetonitrile and dried at RT. Protein spots were then rehydrated using 10mM DTT in 25 mM ammonium bicarbonate pH 8.0 for 45 min at 56°C. This solution was replaced by 55 mM iodoacetamide in 25 mM ammonium bicarbonate pH 8.0 and the gel pieces were incubated for 30 min at room temperature in the dark. They were then washed twice in 25 mM ammonium bicarbonate and finally shrunk by incubation for 5 min with 25 mM ammonium bicarbonate in 50% acetonitrile. The resulting alkylated gel pieces were dried at room temperature. The dried gel pieces were reswollen by incubation in 25 mM ammonium bicarbonate pH 8.0 supplemented with 12.5 ng/µl trypsin (Promega) for 1h at 4°C and then incubated overnight at 37°C. Peptides were harvested by collecting the initial digestion solution and carrying out two extractions; first in 5% formic acid and then in 5% formic acid in 60% acetonitrile. Pooled extracts were dried down in a centrifugal vacuum system. Samples were reconstituted in 0.1% TFA 4% acetonitrile before mass spectrometry using an Orbitrap Fusion Lumos Tribrid Mass Spectrometer (ThermoFisher Scientific, San Jose, CA) online with an Ultimate 3000RSLCnano chromatography system (ThermoFisher Scientific, Sunnyvale, CA). Peptides were separated at 40°C using a two steps linear gradient (4–20% acetonitrile/H2O; 0.1% formic acid for 110 min and 20-32% acetonitrile/H2O; 0.1% formic acid for 10 min). An EASY-Spray nanosource was used for peptide ionization (2,200 V, 275°C). MS was conducted using a data-dependent acquisition mode (DDA). The Orbitrap Lumos was used in data dependent mode to switch consistently between MS and MS/MS. Time between Masters Scans was set to 3 seconds. MS spectra were acquired with the Orbitrap in the range of m/z 400-1600 at a FWHM resolution of 120 000 measured at 400 m/z. AGC target was set at 4.0e5 with a 50 ms Maximum Injection Time. For internal mass calibration the 445.120025 ion was used as lock mass. The more abundant precursor ions were selected and collision-induced dissociation fragmentation was performed in the ion trap to have maximum sensitivity and yield a maximum amount of MS/MS data. Number of precursor ions was automatically defined along run in 3s windows using the “Inject Ions for All Available parallelizable time option” with a maximum injection time of 300 ms. The signal threshold for an MS/MS event was set to 5000 counts. Charge state screening was enabled to exclude precursors with 0 and 1 charge states. Dynamic exclusion was enabled with a repeat count of 1 and duration of 60 s.For identification of PTMs the region corresponding to Snf2-GFP was excised from the gel and subjected to enzymatic digestion under the same conditions as above. Raw mass spectrometry files were analysed using MaxQuant software (version 1.6.3.4) as above with the exception of the Max Missed cleavage set at 5, the FDR at peptide and proteins levels at 5% and with the following variable modifications activated; Lysine acetylation (+42.0106); Serine, threonine and tyrosine phosphorylation (+79.966); Lysine and arginine methylation (+14.0157), dimethylation (+28.0313) and trimethylation (+42.0470).Data Processing ProtocolRelative intensity-based label-free quantification (LFQ) was processed using the MaxLFQ algorithm from the freely available MaxQuant computational proteomics platform, version 1.6.2.1 (Cox et al. 2014, Cox et al. 2008). The acquired raw LC Orbitrap MS data were first processed using the integrated Andromeda search engine (Cox et 2011). Spectra were searched against the Saccharomyces cerevisiae (organism ID 4932) extracted from UniProt containing 7904 entries. The following parameters were used for searches: (i) trypsin allowing cleavage before proline; (ii) two missed cleavage was allowed; (iii) cysteine carbamidomethylation (+57.02146) as a fixed modification and methionine oxidation (+15.99491) and N-terminal acetylation (+42.0106) as variable modifications. The match between runs option was enabled. The false discovery rate (FDR) at the peptide and protein levels were set to 1% and determined by searching a reverse database. For protein grouping, all proteins that cannot be distinguished based on their identified peptides were assembled into a single entry according to the MaxQuant rules. The statistical analysis was done with Perseus program (version 1.6.1.3) (Tyanova and Cox 2018) from the MaxQuant environment (www.maxquant.org). Quantifiable proteins were defined as those detected in above 70% of samples in one condition or more. Protein LFQ normalized intensities were base 2 logarithmized to obtain a normal distribution. Missing values were replaced using data imputation by randomly selecting from a normal distribution centered on the lower edge of the intensity values that simulates signals of low abundant proteins using default parameters (a downshift of 1.8 standard deviation and a width of 0.3 of the original distribution). The protein composition of the complex was determined using, a two-sample t-test using permutation-based FDR-controlled at 0.01 and employing 250 permutations and a scaling factor s0 with a value of 3. All proteins passing these criteria with a positive fold change are considered to be the potential interactome of Snf2.AntibodiesFor IP: Mouse anti-FLAG (Sigma M2 #F1804); 10 μl/IP with Dynabeads and Protein G. For westerns - primary antibodies: Mouse anti-c-MYC (Santa Cruz #SC-40x) 1:1000; Rat anti-FLAG (Agilent #200474) 1:1000; Mouse anti-Gal4 Binding Domain (Euromedex) 1:5000; Rabbit anti-Smt3 is a gift from B. Palancade (Institut Jacques Monod, Paris). Anti-Bre2 is a gift from Peter Nagy. The rabbit anti-Spp1 antibody was developed in V. Géli’s lab. The anti-Spp1 antibody is showing significant cross-reactivity with other cellular proteins but did allow the identification of Spp1 in purified and partially purified fractions. Secondary antibodies: Goat anti-mouse IRDye680RD (LI-COR #926-68070) 1:10,000, Goat anti-rat IRDye800RD (LI-COR #926-32219) 1:10,000.Data availabilityAdditional data and reagents are available upon request to the corresponding authors. The mass spectrometry proteomics data have been deposited to the ProteomeXchange Consortium (www.proteomexchange.org) via the PRIDE partner repository (https://www.ebi.ac.uk/pride/login): Snf2-B3 data (accession number PXD061448), Snf2-GFP complex (accession number PXD061496), Snf2 PTM (accession number PXD061531).AcknowledgementsWe are grateful to Sandra Holbein and Andre Halbach for help with MBP-Nrm1 fusion proteins. We thank Benoit Palancade for his help in the interpretation of the Y2H results and reagents.Additional informationFundingThis work is supported by the “Ligue Nationale Contre le Cancer” (LNCC) (Equipe labellisée, GELI/2019). Funding to B.D. was provided by grants from the Swiss National Science Foundation (PP00A--102941/1 and 31003A_1327010). I.E.M. was funded by Wellcome Trust PhD Studentship (105256) and work in the Wellcome Centre for Cell Biology was supported by Wellcome core funding (092076). Funding to M. O. was provided by the Natural Sciences and Engineering Research Council of Canada to M.O. (RGPIN-2020-06924). Funding to J. K was provided by the National Research Foundation of Korea (NRF-2022R1A2C3012803). Y. H. K is supported by the National Research Foundation of Korea (NRF) grant funded by the Korea government (MSIT) (No. RS-2024-00454407). Proteomics analyses using the mass spectrometry facility of Marseille Proteomics (marseille-proteomique.univ-amu.fr) are supported by IBISA, the Cancéropôle PACA, the Provence-Alpes-Côte d’Azur Region, the Institut Paoli-Calmettes, and Fonds Européens de Développement Regional (FEDER).Author contributionsB.D. J. K and V.G. designed the study and secured the funding. All the Y2H screens and prey identification were performed by Hybrigenics in close interaction with B.D. and V. G. P.L. performed molecular cloning, contributed to validation experiments, and purified Snf2-GFP for subsequent analyses. SET1C and SET1C-C762 purification and interaction assays with Snf2-AT-hook were performed by J. K. and K.P. Set1 SUMOylation experiments were performed by C. N. M. D and B. D. organized the results shown in Table S2. L. L constructed the F1-F5 fragments and contributed to validation experiments. Pull-down experiments and Nrm1 methylation assay were performed by B. D. TAP-Nis1 data were provided by M.O. I.M. and J. B. performed and discuss the Set1/Prp22 interaction. D.K. P and H. H. K performed mass spectrometry analysis of the Snf2-B3. S.A. and L.C. performed mass spectrometry analysis of the Snf2-GFP. V.G. and B. D. wrote the manuscript with inputs of the authors.FundingLigue Contre le Cancer (laliguecancer) (GELI/2019)Vincent GeliSwiss Re | Swiss Re Foundation (SRF) (PP00A--102941/1)Bernhard DichtlWellcome Trust (WT)https://doi.org/10.35802/105256Isabella E MaudlinNatural Sciences and Engineering Research Council of Canada (NSERC) (RGPIN-2020-06924)Marlene OeffingerNational Research Foundation of Korea (NRF) (NRF-2022R1A2C3012803)Jaehoon KimNational Research Foundation of Korea (NRF) (RS-2024-00454407)Young Hye KimAdditional filesSupplementary information.Table S2. All SET1C interactors identified in the 10 Y2H screens. The interactors common to several subunit and to common Set1 fragments are shown on sheets 12 and 13 of the table, respectively.Table S3. Mass spectrometry analysis of TAP-Nis1 affinity purification.Table S4. H3K4-like domain proteins. We used the scansite search algorithm (http://scansite.mit.edu) and systematically identified sequence motifs that are related to the Set1C modification site in histone H3.Table S5. Snf2-GFP complex in WT and set1∆ cells.Table S6. Snf2 post-translational modifications in either WT or set1∆ strains.ReferencesAcquaviva LDrogat JDehé P-Mde La Roche Saint-André CGéli V2013aSpp1 at the crossroads of H3K4me3 regulation and meiotic recombinationEpigenetics 8:355–360Google ScholarAcquaviva LSzekvolgyi LDichtl BDichtl BSSaint Andre C d LRNicolas AGeli V2013bThe COMPASS Subunit Spp1 Links Histone Methylation to Initiation of Meiotic RecombinationScience 339:215–218Google ScholarAdam CGuérois RCitarella AVerardi LAdolphe FBéneut CSommermeyer VRamus CGovin JCouté Yet al2018The PHD finger protein Spp1 has distinct functions in the Set1 and the meiotic DSB formation complexesPLoS Genet 14:e1007223Google ScholarAn DKim JMoon BKim HNguyen HPark SLee JEKim J-AKim J2025PRMT1-mediated methylation regulates MLL2 stability and gene expressionNucleic Acids Res 53Google ScholarAn SYoon JKim HSong J-JCho U-S2017Structure-based nuclear import mechanism of histones H3 and H4 mediated by Kap123eLife 6:e30244https://doi.org/10.7554/eLife.30244Google ScholarArigo JTCarroll KLAmes JMCorden JL2006Regulation of yeast NRD1 expression by premature transcription terminationMol Cell 21:641–651Google ScholarBae HJDubarry MJeon JSoares LMDargemont CKim JGeli VBuratowski S2020The Set1 N-terminal domain and Swd2 interact with RNA polymerase II CTD to recruit COMPASSNat Commun 11:2181Google ScholarBaker RPHarreman MTEccleston JFCorbett AHStewart M2001Interaction between Ran and Mog1 is required for efficient nuclear protein importJ Biol Chem 276:41255–41262Google ScholarBalk JPierik AJNetz DJAMühlenhoff ULill R2004The hydrogenase-like Nar1p is essential for maturation of cytosolic and nuclear iron-sulphur proteinsEMBO J 23:2105–2115Google ScholarBattaglia SLidschreiber MBaejen CTorkler PVos SMCramer P2017RNA-dependent chromatin association of transcription elongation factors and Pol II CTD kinaseseLife 6:e25637https://doi.org/10.7554/eLife.25637Google ScholarBeck MHurt E2017The nuclear pore complex: understanding its function through structural insightNat Rev Mol Cell Biol 18:73–89Google ScholarBeilharz THHarrison PFMiles DMSee MMLe UMMKalanon MCurtis MJHasan QSaksouk JMargaritis Tet al2017Coordination of Cell Cycle Progression and Mitotic Spindle Assembly Involves Histone H3 Lysine 4 Methylation by Set1/COMPASSGenetics 205:185–199Google ScholarBerretta JPinskaya MMorillon A2008A cryptic unstable transcript mediates transcriptional trans-silencing of the Ty1 retrotransposon in S. cerevisiaeGenes Amp Dev 22:615–626Google ScholarBorde VRobine NLin WBonfils SGéli VNicolas A2008Histone H3 lysine 4 trimethylation marks meiotic recombination initiation sitesEMBO J 28:99–111Google ScholarBriggs SDBryk MStrahl BDCheung WLDavie JKDent SYWinston FAllis CD2001Histone H3 lysine 4 methylation is mediated by Set1 and required for cell growth and rDNA silencing in Saccharomyces cerevisiaeGenes Amp Dev 15:3286–3295Google Scholarde Bruin RAMKalashnikova TIChahwan CMcDonald WHWohlschlegel JYates JRussell PWittenberg C2006Constraining G1-specific transcription to late G1 phase: the MBF-associated corepressor Nrm1 acts via negative feedbackMol Cell 23:483–496Google ScholarBryk MBriggs SDStrahl BDCurcio MJAllis CDWinston F2002Evidence that Set1, a factor required for methylation of histone H3, regulates rDNA silencing in S. cerevisiae by a Sir2-independent mechanismCurr Biol CB 12:165–170Google ScholarCastelnuovo MRahman SGuffanti EInfantino VStutz FZenklusen D2013Bimodal expression of PHO84 is modulated by early termination of antisense transcriptionNat Struct Mol Biol 20:851–858Google ScholarCastelnuovo MZaugg JBGuffanti EMaffioletti ACamblong JXu ZClauder-Münster SSteinmetz LMLuscombe NMStutz F2014Role of histone modifications and early termination in pervasive transcription and antisense-mediated gene silencing in yeastNucleic Acids Res 42:4348–4362Google ScholarCenik BKShilatifard A2021COMPASS and SWI/SNF complexes in development and diseaseNat Rev Genet 22:38–58Google ScholarCheng HHe XMoore C2004The Essential WD Repeat Protein Swd2 Has Dual Functions in RNA Polymerase II Transcription Termination and Lysine 4 Methylation of Histone H3Mol Cell Biol 24:2932–2943Google ScholarChern M-KChang K-NLiu L-FTam T-CSLiu Y-CLiang Y-LTam MF2002Yeast Ribosomal Protein L12 Is a Substrate of Protein-arginine Methyltransferase 2J Biol Chem 277:15345–15353Google ScholarChoi JRajagopal AXu Y-FRabinowitz JDO’Shea EK2017A systematic genetic screen for genes involved in sensing inorganic phosphate availability in Saccharomyces cerevisiaePloS One 12:e0176085Google ScholarChong SYCutler SLin J-JTsai C-HTsai H-KBiggins STsukiyama TLo Y-CKao C-F2020H3K4 methylation at active genes mitigates transcription-replication conflicts during replication stressNat Commun 11:809Google ScholarChoudhury RSingh SArumugam SRoguev AStewart AF2019The Set1 complex is dimeric and acts with Jhd2 demethylation to convey symmetrical H3K4 trimethylationGenes Dev 33:550–564Google ScholarCorda YSchramke VLonghese MPSmokvina TPaciotti VBrevet VGilson EGeli V1999Interaction between Set1p and checkpoint protein Mec3p in DNA repair and telomere functionsNat Genet 21:204–208Google ScholarCôté JQuinn JWorkman JLPeterson CL1994Stimulation of GAL4 derivative binding to nucleosomal DNA by the yeast SWI/SNF complexScience 265:53–60Google ScholarDaicho KKoike NOtt RGDaum GUshimaru T2020TORC1 ensures membrane trafficking of Tat2 tryptophan permease via a novel transcriptional activator Vhr2 in budding yeastCell Signal 68:109542Google ScholarDehe PMDichtl BSchaft DRoguev APamblanco MLebrun RRodriguez-Gil AMkandawire MLandsberg KShevchenko Aet al2006Protein Interactions within the Set1 Complex and Their Roles in the Regulation of Histone 3 Lysine 4 MethylationJ Biol Chem 281:35404–35412Google ScholarDehé P-MGéli V2006The multiple faces of Set1Biochem Cell Biol Biochim Biol Cell 84:536–548Google ScholarDelamarre ABarthe Ade la Roche Saint-André CLuciano PForey RPadioleau ISkrzypczak MGinalski KGéli VPasero Pet al2020MRX Increases Chromatin Accessibility at Stalled Replication Forks to Promote Nascent DNA Resection and Cohesin LoadingMol Cell 77:395–410Google ScholarDeshpande NBryk M2023Diverse and dynamic forms of gene regulation by the S. cerevisiae histone methyltransferase Set1Curr Genet 69:91–114Google ScholarDeshpande NJordan RHenderson Pozzi MBryk M2022Histone 3 lysine 4 monomethylation supports activation of transcription in S. cerevisiae during nutrient stressCurr Genet 68:181–194Google ScholarDichtl B2004Functions for S. cerevisiae Swd2p in 3’ end formation of specific mRNAs and snoRNAs and global histone 3 lysine 4 methylationRNA 10:965–977Google ScholarDichtl BBlank DSadowski MHübner WWeiser SKeller W2002Yhh1p/Cft1p directly links poly(A) site recognition and RNA polymerase II transcription terminationEMBO J 21:4125–4135Google Scholarvan Dijk ELChen CLd’Aubenton-Carafa YGourvennec SKwapisz MRoche VBertrand CSilvain MLegoix-Né PLoeillet Set al2011XUTs are a class of Xrn1-sensitive antisense regulatory non-coding RNA in yeastNature 475:114–117Google ScholarDover JSchneider JTawiah-Boateng MAWood ADean KJohnston MShilatifard A2002Methylation of histone H3 by COMPASS requires ubiquitination of histone H2B by Rad6J Biol Chem 277:28368–28371Google ScholarD’Urso ATakahashi Y-HXiong BMarone JCoukos RRandise-Hinchliff CWang J-PShilatifard ABrickner JH2016Set1/COMPASS and Mediator are repurposed to promote epigenetic transcriptional memoryeLife 5:111Google ScholarFaucher DWellinger RJ2010Methylated H3K4, a Transcription-Associated Histone Modification, Is Involved in the DNA Damage Response PathwayPLoS Genet 6:e1001082Google ScholarFormstecher EAresta SCollura VHamburger AMeil ATrehin AReverdy CBetin VMaire SBrun Cet al2005Protein interaction mapping: a Drosophila case studyGenome Res 15:376–384Google ScholarFromont-Racine MRain JCLegrain P1997Toward a functional analysis of the yeast genome through exhaustive two-hybrid screensNat Genet 16:277–282Google ScholarGhaddar NCorda YLuciano PGalli MDoksani YGéli V2023The COMPASS subunit Spp1 protects nascent DNA at the Tus/Ter replication fork barrier by limiting DNA availability to nucleasesNat Commun 14:5430Google ScholarGiaever GLissina ENislow C2019Network dynamics of the yeast methyltransferomeMicrob Cell Graz Austria 6:356–369Google ScholarGong XWang SYu QWang MGe FLi SYu X2023Cla4 phosphorylates histone methyltransferase Set1 to prevent its degradation by the APC/CCdh1 complexSci Adv 9:eadi7238Google ScholarGrainger RJBeggs JD2005Prp8 protein: at the heart of the spliceosomeRNA N Y N 11:533–557Google ScholarGreen DMMarfatia KACrafton EBZhang XCheng XCorbett AH2002Nab2p is required for poly(A) RNA export in Saccharomyces cerevisiae and is regulated by arginine methylation via Hmt1pJ Biol Chem 277:7752–7760Google ScholarGuccione EBassi CCasadio FMartinato FCesaroni MSchuchlautz HLüscher BAmati B2007Methylation of histone H3R2 by PRMT6 and H3K4 by an MLL complex are mutually exclusiveNature 449:933–937Google ScholarGuillemette BDrogaris PLin H-HSArmstrong HHiragami-Hamada KImhof ABonneil ÉThibault PVerreault AFestenstein RJ2011H3 Lysine 4 Is Acetylated at Active Gene Promoters and Is Regulated by H3 Lysine 4 MethylationPLOS Genet 7:1–16Google ScholarGuy MPPodyma BMPreston MAShaheen HHKrivos KLLimbach PAHopper AKPhizicky EM2012Yeast Trm7 interacts with distinct proteins for critical modifications of the tRNAPhe anticodon loopRNA N Y N 18:1921–1933Google ScholarHalbach AZhang HWengi AJablonska ZGruber IMLHalbeisen REDehé P-MKemmeren PHolstege FGéli Vet al2009Cotranslational assembly of the yeast SET1C histone methyltransferase complexEMBO J 28:2959–2970Google ScholarHamey JJRakow SBouchard CSenst JMKolb PBauer UWilkins MRHart-Smith G2021Systematic investigation of PRMT6 substrate recognition reveals broad specificity with a preference for an RG motif or basic and bulky residuesFebs J 288:5668–5691Google ScholarHannich JTLewis AKroetz MBLi S-JHeide HEmili AHochstrasser M2005Defining the SUMO-modified proteome by multiple approaches in Saccharomyces cerevisiaeJ Biol Chem 280:4102–4110Google ScholarHe CLiu NXie DLiu YXiao YLi F2019Structural basis for histone H3K4me3 recognition by the N-terminal domain of the PHD finger protein Spp1Biochem J 476:1957–1973Google ScholarHenke RMDastidar RGShah ACadinu DYao XHooda JZhang L2011Hypoxia elicits broad and systematic changes in protein subcellular localizationAm J Physiol Cell Physiol 301:C913–928Google ScholarHirschhorn JNBrown SAClark CDWinston F1992Evidence that SNF2/SWI2 and SNF5 activate transcription in yeast by altering chromatin structureGenes Dev 6:2288–2298Google ScholarHowe FSBoubriak ISale MJNair AClynes DGrijzenhout AMurray SCWoloszczuk RMellor J2014Lysine acetylation controls local protein conformation by influencing proline isomerizationMol Cell 55:733–744Google ScholarHsu PLLi HLau H-TLeonen CDhall AOng S-EChatterjee CZheng N2018Crystal Structure of the COMPASS H3K4 Methyltransferase Catalytic ModuleCell 174:1106–1116Google ScholarHsu PLShi HLeonen CKang JChatterjee CZheng N2019Structural Basis of H2B Ubiquitination-Dependent H3K4 Methylation by COMPASSMol Cell 76:712–723Google ScholarHuang FChandrasekharan MBChen Y-CBhaskara SHiebert SWSun Z-W2010The JmjN domain of Jhd2 is important for its protein stability, and the plant homeodomain (PHD) finger mediates its chromatin association independent of H3K4 methylationJ Biol Chem 285:24548–24561Google ScholarHyllus DStein CSchnabel KSchiltz EImhof ADou YHsieh JBauer U-M2007PRMT6-mediated methylation of R2 in histone H3 antagonizes H3 K4 trimethylationGenes Dev 21:3369–3380Google ScholarIwase MToh-e A2001Nis1 encoded by YNL078W: a new neck protein of Saccharomyces cerevisiaeGenes Genet Syst 76:335–343Google ScholarJackson CAYadav NMin SLi JMilliman EJQu JChen YCYu MC2012Proteomic analysis of interactors for yeast protein arginine methyltransferase Hmt1 reveals novel substrate and insights into additional biological rolesProteomics 12:3304–3314Google ScholarJanke CMagiera MMRathfelder NTaxis CReber SMaekawa HMoreno-Borchart ADoenges GSchwob ESchiebel Eet al2004A versatile toolbox for PCR-based tagging of yeast genes: new fluorescent proteins, more markers and promoter substitution cassettesYeast 21:947–962Google ScholarJeon JMcGinty RKMuir TWKim J-AKim J2018Crosstalk among Set1 complex subunits involved in H2B ubiquitylation-dependent H3K4 methylationNucleic Acids Res 46:11129–11143Google ScholarJezek MSun WNegesse MYSmith ZMOrosz AGreen EM2023Set1 regulates telomere function via H3K4 methylation-dependent and -independent pathways and calibrates the abundance of telomere maintenance factorsMol Biol Cell 34:ar6Google ScholarKaczmarek Michaels KMohd Mostafa SRuiz Capella JMoore CL2020Regulation of alternative polyadenylation in the yeast Saccharomyces cerevisiae by histone H3K4 and H3K36 methyltransferasesNucleic Acids Res 48:5407–5425Google ScholarKan JZou LZhang JWu RWang ZLiang C2008Origin Recognition Complex (ORC) Mediates Histone 3 Lysine 4 Methylation through Cooperation with Spp1 in Saccharomyces cerevisiaeJ Biol Chem 283:33803–33807Google ScholarKarányi ZHalász LAcquaviva LJónás DHetey SBoros-Oláh BPeng FChen DKlein FGéli Vet al2018Nuclear dynamics of the Set1C subunit Spp1 prepares meiotic recombination sites for break formationJ Cell Biol 217:3398–3415Google ScholarKim JKim J-AMcGinty RKNguyen UTTMuir TWAllis CDRoeder RG2013The n-SET Domain of Set1 Regulates H2B Ubiquitylation-Dependent H3K4 MethylationMol Cell 49:1121–1133Google ScholarKim JRoeder RG2011Nucleosomal H2B ubiquitylation with purified factorsMethods San Diego Calif 54:331–338Google ScholarKim J-HSaraf AFlorens LWashburn MWorkman JL2010Gcn5 regulates the dissociation of SWI/SNF from chromatin by acetylation of Swi2/Snf2Genes Dev 24:2766–2771Google ScholarKim MVasiljeva LRando OJZhelkovsky AMoore CBuratowski S2006Distinct pathways for snoRNA and mRNA terminationMol Cell 24:723–734Google ScholarKim TBuratowski S2009Dimethylation of H3K4 by Set1 recruits the Set3 histone deacetylase complex to 5’ transcribed regionsCell 137:259–272Google ScholarKirmizis ASantos-Rosa HPenkett CJSinger MAGreen RDKouzarides T2009Distinct transcriptional outputs associated with mono- and dimethylated histone H3 arginine 2Nat Struct Mol Biol 16:449–451Google ScholarKirmizis ASantos-Rosa HPenkett CJSinger MAVermeulen MMann MBähler JGreen RDKouzarides T2007Arginine methylation at histone H3R2 controls deposition of H3K4 trimethylationNature 449:928–932Google Scholarde La Roche Saint-André CGéli V2021Set1-dependent H3K4 methylation becomes critical for limiting DNA damage in response to changes in S-phase dynamics in Saccharomyces cerevisiaeDNA Repair 105:103159Google ScholarLaribee RNShibata YMersman DPCollins SRKemmeren PRoguev AWeissman JSBriggs SDKrogan NJStrahl BD2007CCR4/NOT complex associates with the proteasome and regulates histone methylationProc Natl Acad Sci U S A 104:5836–5841Google ScholarLee DCAitchison JD1999Kap104p-mediated nuclear import. Nuclear localization signals in mRNA-binding proteins and the role of Ran and RnaJ Biol Chem 274:29031–29037Google ScholarLee KWang K2018Small Noncoding RNAs in Agrobacterium tumefaciensCurr Top Microbiol Immunol 418:195–213Google ScholarLee KYChopra ABurke GLChen ZGreenblatt JFBiggar KKMeneghini MD2020A crucial RNA-binding lysine residue in the Nab3 RRM domain undergoes SET1 and SET3-responsive methylationNucleic Acids Res 48:2897–2911Google ScholarLee Y-SMulugu SYork JDO’Shea EK2007Regulation of a cyclin-CDK-CDK inhibitor complex by inositol pyrophosphatesScience 316:109–112Google ScholarLees NDSkaggs BKirsch DRBard M1995Cloning of the late genes in the ergosterol biosynthetic pathway of Saccharomyces cerevisiae--a reviewLipids 30:221–226Google ScholarLi H-TGong TZhou ZLiu Y-TCao XHe YChen CDZhou J-Q2015aYeast Hmt1 catalyses asymmetric dimethylation of histone H3 arginine 2 in vitroBiochem J 467:507–515Google ScholarLi NZhai YZhang YLi WYang MLei JTye B-KGao N2015bStructure of the eukaryotic MCM complex at 3.8 ÅNature 524:186–191Google ScholarLiang GKlose RJGardner KEZhang Y2007Yeast Jhd2p is a histone H3 Lys4 trimethyl demethylaseNat Struct Mol Biol 14:243–245Google ScholarLiu HYChiang YCPan JChen JSalvadore CAudino DCBadarinarayana VPalaniswamy VAnderson BDenis CL2001Characterization of CAF4 and CAF16 reveals a functional connection between the CCR4-NOT complex and a subset of SRB proteins of the RNA polymerase II holoenzymeJ Biol Chem 276:7541–7548Google ScholarLiu JLiu JStråby KB1998Point and deletion mutations eliminate one or both methyl group transfers catalysed by the yeast TRM1 encoded tRNA (m22G26)dimethyltransferaseNucleic Acids Res 26:5102–5108Google ScholarLow JKKWilkins MR2012Protein arginine methylation in Saccharomyces cerevisiaeFebs J 279:4423–4443Google ScholarLuciano PJeon JEl-Kaoutari AChallal DBonnet ABarucco MCandelli TJourquin FLesage PKim Jet al2017Binding to RNA regulates Set1 functionCell Discov 3:17040Google ScholarMargaritis TOreal VBrabers NMaestroni LVitaliano-Prunier ABenschop JJvan Hooff Svan Leenen DDargemont CGéli Vet al2012Two distinct repressive mechanisms for histone 3 lysine 4 methylation through promoting 3’-end antisense transcriptionPLoS Genet 8:e1002952Google ScholarMcBride AECook JTStemmler EARutledge KLMcGrath KARubens JA2005Arginine methylation of yeast mRNA-binding protein Npl3 directly affects its function, nuclear export, and intranuclear protein interactionsJ Biol Chem 280:30888–30898Google ScholarMei QXu CGogol MTang JChen WYu XWorkman JLLi S2019Set1-catalyzed H3K4 trimethylation antagonizes the HIR/Asf1/Rtt106 repressor complex to promote histone gene expression and chronological life spanNucleic Acids Res 47:3434–3449Google ScholarMeitinger FKhmelinskii AMorlot SKurtulmus BPalani SAndres-Pons AHub BKnop MCharvin GPereira G2014A memory system of negative polarity cues prevents replicative agingCell 159:1056–1069Google ScholarMendoza-Ochoa GIBarrass JDMaudlin IEBeggs JD2019Blocking late stages of splicing quickly limits pre-spliceosome assembly in vivoRNA Biol 16:1775–1784Google ScholarMersman DPDu H-NFingerman IMSouth PFBriggs SD2009Polyubiquitination of the demethylase Jhd2 controls histone methylation and gene expressionGenes Dev 23:951–962Google ScholarMiller TKrogan NJDover JErdjument-Bromage HTempst PJohnston MGreenblatt JFShilatifard A2001COMPASS: a complex of proteins associated with a trithorax-related SET domain proteinProc Natl Acad Sci U S A 98:12902–12907Google ScholarMizuno TNakamura MIrie K2018Induction of Ptp2 and Cmp2 protein phosphatases is crucial for the adaptive response to ER stress in Saccharomyces cerevisiaeSci Rep 8:13078Google ScholarMulder KWBrenkman ABInagaki Avan den Broek NJFTimmers HTM2007Regulation of histone H3K4 tri-methylation and PAF complex recruitment by the Ccr4-Not complexNucleic Acids Res 35:2428–2439Google ScholarMullen JRChen C-FBrill SJ2010Wss1 is a SUMO-dependent isopeptidase that interacts genetically with the Slx5-Slx8 SUMO-targeted ubiquitin ligaseMol Cell Biol 30:3737–3748Google ScholarMulugu SBai WFridy PCBastidas RJOtto JCDollins DEHaystead TARibeiro AAYork JD2007A conserved family of enzymes that phosphorylate inositol hexakisphosphateScience 316:106–109Google ScholarMurray SCHaenni SHowe FSFischl HChocian KNair AMellor J2015Sense and antisense transcription are associated with distinct chromatin architectures across genesNucleic Acids Res 43:7823–7837Google ScholarNadal-Ribelles MMas GMillán-Zambrano GSolé CAmmerer GChávez SPosas Fde Nadal E2015H3K4 monomethylation dictates nucleosome dynamics and chromatin remodeling at stress-responsive genesNucleic Acids Res 43:4937–4949Google ScholarNagy PLGriesenbeck JKornberg RDCleary ML2002A trithorax-group complex purified from Saccharomyces cerevisiae is required for methylation of histone H3Proc Natl Acad Sci U S A 99:90–94Google ScholarNakagawa TKolodner RD2002The MER3 DNA helicase catalyzes the unwinding of holliday junctionsJ Biol Chem 277:28019–28024Google ScholarNayak AViale-Bouroncle SMorsczeck CMuller S2014The SUMO-specific isopeptidase SENP3 regulates MLL1/MLL2 methyltransferase complexes and controls osteogenic differentiationMol Cell 55:47–58Google ScholarNedea EHe XKim MPootoolal JZhong GCanadien VHughes TBuratowski SMoore CLGreenblatt J2003Organization and Function of APT, a Subcomplex of the Yeast Cleavage and Polyadenylation Factor Involved in the Formation of mRNA and Small Nucleolar RNA 3’-EndsJ Biol Chem 278:33000–33010Google ScholarNedea ENalbant DXia DTheoharis NTSuter BRichardson CJTatchell KKislinger TGreenblatt JFNagy PL2008The Glc7 Phosphatase Subunit of the Cleavage and Polyadenylation Factor Is Essential for Transcription Termination on snoRNA GenesMol Cell 29:577–587Google ScholarNg HHRobert FYoung RAStruhl K2003Targeted recruitment of Set1 histone methylase by elongating Pol II provides a localized mark and memory of recent transcriptional activityMol Cell 11:709–719Google ScholarNie MVashisht AAWohlschlegel JABoddy MN2015High Confidence Fission Yeast SUMO Conjugates Identified by Tandem Denaturing Affinity PurificationSci Rep 5:14389Google ScholarNiño CAGuet DGay ABrutus SJourquin FMendiratta SSalamero JGéli VDargemont C2016Posttranslational marks control architectural and functional plasticity of the nuclear pore complex basketJ Cell Biol 212:167–180Google ScholarNislow CRay EPillus L1997SET1, a yeast member of the trithorax family, functions in transcriptional silencing and diverse cellular processesMol Biol Cell 8:2421–2436Google ScholarNoma AKirino YIkeuchi YSuzuki T2006Biosynthesis of wybutosine, a hyper-modified nucleoside in eukaryotic phenylalanine tRNAEMBO J 25:2142–2154Google ScholarOki MNishimoto T1998A protein required for nuclear-protein import, Mog1p, directly interacts with GTP-Gsp1p, the Saccharomyces cerevisiae ran homologueProc Natl Acad Sci U S A 95:15388–15393Google ScholarOliete-Calvo PSerrano-Quílez JNuño-Cabanes CPérez-Martínez MESoares LMDichtl BBuratowski SPérez-Ortín JERodríguez-Navarro S2018A role for Mog1 in H2Bub1 and H3K4me3 regulation affecting RNAPII transcription and mRNA exportEMBO Rep 19:e45992Google ScholarPal SVishwanath SNErdjument-Bromage HTempst PSif S2004Human SWI/SNF-Associated PRMT5 Methylates Histone H3 Arginine 8 and Negatively Regulates Expression of ST7 and NM23 Tumor Suppressor GenesMol Cell Biol 24:9630–9645Google ScholarPemberton LFRosenblum JSBlobel G1997A distinct and parallel pathway for the nuclear import of an mRNA-binding proteinJ Cell Biol 139:1645–1653Google ScholarPerez AMThorner J2019Septin-associated proteins Aim44 and Nis1 traffic between the bud neck and the nucleus in the yeast Saccharomyces cerevisiaeCytoskelet Hoboken NJ 76:15–32Google ScholarPoornima GSrivastava GRoy BKuttanda IAKurbah IRajyaguru PI2021RGG-motif containing mRNA export factor Gbp2 acts as a translation repressorRNA Biol 18:2342–2353Google ScholarQu QTakahashi Y-HYang YHu HZhang YBrunzelle JSCouture J-FShilatifard ASkiniotis G2018Structure and Conformational Dynamics of a COMPASS Histone H3K4 Methyltransferase ComplexCell 174:1117–1126Google ScholarRadman-Livaja MLiu CLFriedman NSchreiber SLRando OJ2010Replication and Active Demethylation Represent Partially Overlapping Mechanisms for Erasure of H3K4me3 in Budding YeastPLoS Genet 6:e1000837Google ScholarRain JCSelig LDe Reuse HBattaglia VReverdy CSimon SLenzen GPetel FWojcik JSchächter Vet al2001The protein-protein interaction map of Helicobacter pyloriNature 409:211–215Google ScholarRizzardi LFDorn ESStrahl BDCook JG2012DNA replication origin function is promoted by H3K4 di-methylation in Saccharomyces cerevisiaeGenetics 192:371–384Google ScholarRoguev ASchaft DShevchenko APijnappel WWWilm MAasland RStewart AF2001The Saccharomyces cerevisiae Set1 complex includes an Ash2 homologue and methylates histone 3 lysine 4EMBO J 20:7137–7148Google ScholarRuthenburg AJAllis CDWysocka J2007Methylation of lysine 4 on histone H3: intricacy of writing and reading a single epigenetic markMol Cell 25:15–30Google ScholarSantos-Rosa HBannister AJDehe PMGéli VKouzarides T2004Methylation of H3 lysine 4 at euchromatin promotes Sir3p association with heterochromatinJ Biol Chem 279:47506–47512Google ScholarSantos-Rosa HMillán-Zambrano GHan NLeonardi TKlimontova MNasiscionyte SPandolfini LTzelepis KBartke TKouzarides T2021Methylation of histone H3 at lysine 37 by Set1 and Set2 prevents spurious DNA replicationMol Cell 81:2793–2807Google ScholarSayou CMillán-Zambrano GSantos-Rosa HPetfalski ERobson SHouseley JKouzarides TTollervey D2017RNA Binding by Histone Methyltransferases Set1 and Set2Mol Cell Biol 37:e00165–17Google ScholarSchlichter ACairns BR2005Histone trimethylation by Set1 is coordinated by the RRM, autoinhibitory, and catalytic domainsEMBO J 24:1222–1231Google ScholarSchulze JMJackson JNakanishi SGardner JMHentrich THaug JJohnston MJaspersen SLKobor MSShilatifard A2009Linking cell cycle to histone modifications: SBF and H2B monoubiquitination machinery and cell-cycle regulation of H3K79 dimethylationMol Cell 35:626–641Google ScholarSenger BSimos GBischoff FRPodtelejnikov AMann MHurt E1998Mtr10p functions as a nuclear import receptor for the mRNA-binding protein Npl3pEMBO J 17:2196–2207Google ScholarSerra-Cardona ADuan SYu CZhang Z2022H3K4me3 recognition by the COMPASS complex facilitates the restoration of this histone mark following DNA replicationSci Adv 8:eabm6246Google ScholarShin JAChoi ESKim HSHo JCYWatts FZPark SDJang YK2005SUMO modification is involved in the maintenance of heterochromatin stability in fission yeastMol Cell 19:817–828Google ScholarSmith D-LErce MALai Y-WTomasetig FHart-Smith GHamey JJWilkins MR2020Crosstalk of Phosphorylation and Arginine Methylation in Disordered SRGG Repeats of Saccharomycescerevisiae Fibrillarin and Its Association with Nucleolar LocalizationJ Mol Biol 432:448–466Google ScholarSoares LMBuratowski S2012Yeast Swd2 Is Essential Because of Antagonism between Set1 Histone Methyltransferase Complex and APT (Associated with Pta1) Termination FactorJ Biol Chem 287:15219–15231Google ScholarSoares LMHe PCChun YSuh HKim TBuratowski S2017Determinants of Histone H3K4 Methylation PatternsMol Cell 68:773–785Google ScholarSollier JLin WSoustelle CSuhre KNicolas AGéli Vde La Roche Saint-André C2004Set1 is required for meiotic S-phase onset, double-strand break formation and middle gene expressionEMBO J 23:1957–1967Google ScholarSommermeyer VBéneut CChaplais ESerrentino MEBorde V2013Spp1, a member of the Set1 Complex, promotes meiotic DSB formation in promoters by tethering histone H3K4 methylation sites to chromosome axesMol Cell 49:43–54Google ScholarSoniat MSampathkumar PCollett GGizzi ASBanu RNBhosle RCChamala SChowdhury SFiser AGlenn ASet al2013Crystal structure of human Karyopherin β2 bound to the PY-NLS of Saccharomyces cerevisiae Nab2J Struct Funct Genomics 14:31–35Google ScholarSouth PFHarmeyer KMSerratore NDBriggs SD2013H3K4 methyltransferase Set1 is involved in maintenance of ergosterol homeostasis and resistance to Brefeldin AProc Natl Acad Sci U S A 110:E1016–25Google ScholarSüel KEGu HChook YM2008Modular organization and combinatorial energetics of proline-tyrosine nuclear localization signalsPLoS Biol 6:e137Google ScholarSun Z-WAllis CD2002Ubiquitination of histone H2B regulates H3 methylation and gene silencing in yeastNature 418:104–108Google ScholarTakeo KIto T2017Subcellular localization of VIP1 is regulated by phosphorylation and 14-3-3 proteinsFEBS Lett 591:1972–1981Google ScholarTerzi NChurchman LSVasiljeva LWeissman JBuratowski S2011H3K4 Trimethylation by Set1 Promotes Efficient Termination by the Nrd1-Nab3-Sen1 PathwayMol Cell Biol 31:3569–3583Google ScholarThandapani PO’Connor TRBailey TLRichard S2013Defining the RGG/RG motifMol Cell 50:613–623Google ScholarThornton JLWestfield GHTakahashi Y-HCook MGao XWoodfin ARLee J-SMorgan MAJackson JSmith ERet al2014Context dependency of Set1/COMPASS-mediated histone H3 Lys4 trimethylationGenes Dev 28:115–120Google ScholarTrahan COeffinger M2022Single-Step Affinity Purification (ssAP) and Mass Spectrometry of Macromolecular Complexes in the Yeast S. cerevisiaeMethods Mol Biol Clifton NJ 2477:195–223Google ScholarTravesa AKuo Dde Bruin RAMKalashnikova TIGuaderrama MThai KAslanian ASmolka MBYates JRIdeker Tet al2012DNA replication stress differentially regulates G1/S genes via Rad53-dependent inactivation of Nrm1EMBO J 31:1811–1822Google ScholarTrésaugues LDehé P-MGuérois RRodriguez-Gil AVarlet ISalah PPamblanco Mpierre LUCIANOQuevillon-Cheruel SSollier Jet al2006Structural Characterization of Set1 RNA Recognition Motifs and their Role in Histone H3 Lysine 4 MethylationJ Mol Biol 359:1170–1181Google ScholarVitaliano-Prunier AMenant AHobeika MGéli VGwizdek CDargemont C2008Ubiquitylation of the COMPASS component Swd2 links H2B ubiquitylation to H3K4 trimethylationNat Cell Biol 10:1365–1371Google ScholarWalter DMatter AFahrenkrog B2014Loss of histone H3 methylation at lysine 4 triggers apoptosis in Saccharomyces cerevisiaePLoS Genet 10:e1004095Google ScholarWang LCollings CKZhao ZCozzolino KAMa QLiang KMarshall SASze CCHashizume RSavas JNet al2017A cytoplasmic COMPASS is necessary for cell survival and triple-negative breast cancer pathogenesis by regulating metabolismGenes Dev 31:2056–2066Google ScholarWang YDing ZLiu XBao YHuang MWong CCLHong XCong Y2018Architecture and subunit arrangement of the complete Saccharomyces cerevisiae COMPASS complexSci Rep 8:17405Google ScholarWarnecke DCHeinz E1994Purification of a Membrane-Bound UDP-Glucose:Sterol [beta]-D-Glucosyltransferase Based on Its Solubility in Diethyl EtherPlant Physiol 105:1067–1073Google ScholarWeiner AChen HVLiu CLRahat AKlien ASoares LGudipati MPfeffner JRegev ABuratowski Set al2012Systematic Dissection of Roles for Chromatin Regulators in a Yeast Stress ResponsePLoS Biol 10:e1001369Google ScholarWill CLLührmann R2011Spliceosome structure and functionCold Spring Harb Perspect Biol 3:a003707Google ScholarWilson TEPadgett KAJohnston MMilbrandt J1993A genetic method for defining DNA-binding domains: application to the nuclear receptor NGFI-BProc Natl Acad Sci U S A 90:9186–9190Google ScholarWorley JLuo XCapaldi AP2013Inositol pyrophosphates regulate cell growth and the environmental stress response by activating the HDAC Rpd3LCell Rep 3:1476–1482Google ScholarWykoff DDO’Shea EK2005Identification of sumoylated proteins by systematic immunoprecipitation of the budding yeast proteomeMol Cell Proteomics MCP 4:73–83Google ScholarXu DFarmer AChook YM2010Recognition of nuclear targeting signals by Karyopherin-β proteinsCurr Opin Struct Biol 20:782–790Google ScholarYoshida KBlobel G2001The karyopherin Kap142p/Msn5p mediates nuclear import and nuclear export of different cargo proteinsJ Cell Biol 152:729–740Google ScholarYoshimura SHHirano T2016HEAT repeats - versatile arrays of amphiphilic helices working in crowded environments?J Cell Sci 129:3963–3970Google ScholarYuan C-CMatthews AGWJin YChen CFChapman BAOhsumi TKGlass KCKutateladze TGBorowsky MLStruhl Ket al2012Histone H3R2 Symmetric Dimethylation and Histone H3K4 Trimethylation Are Tightly Correlated in Eukaryotic GenomesCell Rep 1:83–90Google ScholarZhang ZShibahara KStillman B2000PCNA connects DNA replication to epigenetic inheritance in yeastNature 408:221–225Google ScholarArticle and author informationAuthor informationPierre Luciano*Marseille Cancer Research Center (CRCM), U1068 Inserm, UMR7258 CNRS, Aix Marseille University, Institut Paoli-Calmettes, Marseille, France. Equipe labellisée LigueORCID iD: 0000-0002-1394-4129*Joint authorsKihyun Park*Department of Biological Sciences, Korea Advanced Institute of Science and Technology, Daejeon, Republic of Korea*Joint authorsStéphane AudebertMarseille Cancer Research Center (CRCM), U1068 Inserm, UMR7258 CNRS, Aix Marseille University, Institut Paoli-Calmettes, Marseille, France. Equipe labellisée LigueORCID iD: 0000-0002-9409-2588Luc CamoinMarseille Cancer Research Center (CRCM), U1068 Inserm, UMR7258 CNRS, Aix Marseille University, Institut Paoli-Calmettes, Marseille, France. Equipe labellisée LigueORCID iD: 0000-0002-1230-4787Carlos A Niño†Marseille Cancer Research Center (CRCM), U1068 Inserm, UMR7258 CNRS, Aix Marseille University, Institut Paoli-Calmettes, Marseille, France. Equipe labellisée Ligue†Present address: Carlos A. Niño, IFOM ETS, The AIRC Institute of Molecular Oncology, Milan, Italy.Da Kyeong ParkOchang Institute of Biological and Environmental Science, Korea Basic Science Institute, Cheongju, Republic of KoreaIsabella E Maudlin‡Wellcome Centre for Cell Biology and Institute of Cell Biology, School of Biological Sciences, University of Edinburgh, Edinburgh, United Kingdom‡Present address: Isabella E. Maudlin, Sir William Dunn School of Pathology, University of Oxford, Oxford, OX1 3RE, UK.Marion Dubarry§Marseille Cancer Research Center (CRCM), U1068 Inserm, UMR7258 CNRS, Aix Marseille University, Institut Paoli-Calmettes, Marseille, France. Equipe labellisée Ligue§Present address: Marion Dubarry, Univ Lyon, Université Claude Bernard Lyon 1, INSA-Lyon, CNRS, UMR5240, Microbiologie, Adaptation et Pathogénie, 10 rue Raphaël Dubois, F-69622, Villeurbanne, FranceLara LeeMarseille Cancer Research Center (CRCM), U1068 Inserm, UMR7258 CNRS, Aix Marseille University, Institut Paoli-Calmettes, Marseille, France. Equipe labellisée LigueMarlene OeffingerInstitut de recherches cliniques de Montréal, Center for Genetic and Neurological Diseases, Montréal, Canada, Département de biochimie et médecine moléculaire, Faculté de Médicine, Université de Montréal, Québec, Canada, Division of Experimental Medicine, Faculty of Medicine, McGill University, Montréal, CanadaJean D BeggsWellcome Centre for Cell Biology and Institute of Cell Biology, School of Biological Sciences, University of Edinburgh, Edinburgh, United KingdomYoung Hye KimOchang Institute of Biological and Environmental Science, Korea Basic Science Institute, Cheongju, Republic of KoreaJaehoon KimDepartment of Biological Sciences, Korea Advanced Institute of Science and Technology, Daejeon, Republic of KoreaFor correspondence: kimjaehoon@kaist.eduBernhard DichtlSchool of Life and Environmental Sciences, Deakin University, Geelong, AustraliaFor correspondence: bernhard.dichtl@deakin.edu.auVincent Géli¶Marseille Cancer Research Center (CRCM), U1068 Inserm, UMR7258 CNRS, Aix Marseille University, Institut Paoli-Calmettes, Marseille, France. Equipe labellisée LigueORCID iD: 0000-0002-4103-7462For correspondence: vincent.geli@inserm.fr¶Present address: Vincent Géli, Institute for Research on Cancer and Aging, Nice (IRCAN), Nice, FranceAuthor NotesCompeting interests: No competing interests declaredVersion historySent for peer review: November 23, 2025Preprint posted: November 29, 2025Reviewed Preprint version 1: March 6, 2026Cite all versionsYou can cite all versions using the DOI https://doi.org/10.7554/eLife.109886. This DOI represents all versions, and will always resolve to the latest one.Copyright© 2026, Luciano et al.This article is distributed under the terms of the Creative Commons Attribution License, which permits unrestricted use and redistribution provided that the original author and source are credited.Metricsviews0downloads0citations0Views, downloads and citations are aggregated across all versions of this paper published by eLife.

来源:e life发布时间:2026-03-06
Trpv4 links environmental temperature to testicular differentiation in hermaphroditic ricefield eel

AbstractThe ricefield eel (Monopterus albus), an economically important aquaculture species in China, is a freshwater teleost fish that exhibits protogynous hermaphroditism. Although progress has been made in understanding the sex determination and differentiation of this species, the underlying mechanisms remain unclear. Here we show that warm temperature promotes gonadal transformation by up-regulating testicular differentiation genes such as dmrt1/sox9a in ovaries. Trpv4, a Ca2+-permeable cation channel expressed in gonadal somatic cells, is highly sensitive to ambient temperature and mediates warm temperature-driven sex change of ricefield eel. In female fish reared at cool temperature, injection of Trpv4 agonist into the ovaries leads to a significant up-regulation of testicular differentiation genes, and in female fish exposed to warm temperature, Trpv4 inhibition or trpv4 siRNA knockdown suppresses warm temperature-induced male gene expression. pStat3 signaling is downstream of Trpv4 and transduces Trpv4-controlled calcium signaling into the sex determination cascades. Inhibition of pStat3 activity prevents the up-regulation of testicular differentiation genes by warm temperature treatment and ovarian injection of Trpv4 agonist, whereas activation of pStat3 is sufficient to induce the expression of male genes, in the presence of Trpv4 antagonist. pStat3 binds and activates jmjd3/kdm6b, an activator of the male gene dmrt1. Consistently, ovarian injection of Kdm6b inhibitor blocks the up-regulation of testicular differentiation genes by warm temperature exposure. We propose that environmental factors, such as temperature, promote gonadal transformation of ricefield eel by inducing the expression of male pathway genes in ovaries via the Trpv4-pStat3-Kdm6b-Dmrt1 axis. Our results provide new insights into the molecular mechanism underlying natural sex change of ricefield eel, which will be useful for sex control in aquaculture.HighlightsWarm temperature promotes gonadal transformation of ricefield eelTrpv4 links environmental temperature and the sex determination pathwaypStat3 is downstream of Trpv4-controlled calcium signalingpStat3 binds and activates kdm6b/jmjd3IntroductionSex determination in animals is intriguing and fascinating. In mammals, sex is determined genetically (genotypic sex determination, GSD). In lower vertebrates such as fish and reptiles, however, sex regulators are diverse. Their sex can be influenced by various environmental factors, including temperature, pH, the breeding density and social status (Gutzke and Crews. 1988; Honeycutt et al. 2019; Mei and Gui, 2015; Todd et al., 2019), the so-called environmental sex determination (ESD). The temperature-dependent sex determination (TSD) is one of the best studied forms of ESD. In red-eared slider turtle (Trachemys scripta), American alligator (Alligator mississippiensis) and Atlantic silverside (Menidia menidia), sex is determined solely by the temperature during the thermosensitive period of embryogenesis. In Australian central bearded dragon (Pogona Vitticeps) and Nile tilapia (Oreochromis niloticus), which display GSD, temperature can override the genetic materials to control the gonadal sex differentiation (Deveson et al., 2017; Holleley et al., 2015). Analysis of expression data during embryogenesis of normal ZW females and temperature sex reversed ZZ females has provided important insights into temperature-driven sex determination in the bearded dragon (Whiteley et al., 2021). Irrespective of TSD or GSD+TE (temperature effects), the downstream components are fairly conserved, including the epigenetic factors such as jmjd3/kdm6b and sex determination genes such as dmrt1 (Castelli et al., 2020; Lu et al., 2025; Martinez-Pacheco et al., 2024; Weber et al., 2020; Whiteley et al., 2020; Wu et al., 2024).Most vertebrates, including the TSD reptiles, exhibit gonochorism. However, approximately 6% of fish species exhibit hermaphroditism, including protandrous, protogynous, and bidirectional hermaphroditism (Todd et al., 2016). The majority of them are marine fish, appearing in 27 families (Muncaster et al., 2013; Peng et al., 2020; Shao et al., 2014; Todd et al., 2019). Compared to marine fish, natural sex change in freshwater fish is very rare. The ricefield eel (Monopterus albus), also called Asian swamp eel, which belongs to the family Synbranchidae in the Synbranchiformes, was firstly discovered as a protogynous hermaphroditic fish by Liu (Liu, 1944; Luo et al., 2026; Zhou and Gui, 2016). The species begins life as a female and then develops into a male through an intersex stage, thus displaying a female-to-male sex reversal during aging. Females are small in size (< 25 cm), and during and after sex change, there is a gradual increase in body size (> 55 cm for the majority of males). Among the described teleost fish species, ricefield eel has the fewest chromosome pairs (n= 12) with the fewest number of chromosome arms (Cheng and Zhou, 2022), and is emerging as an important model animal for studying sex determination and differentiation as well as adaptive evolution (Ji et al., 2001). As early as the Ming Dynasty in ancient China in 1578, pharmacist Shi-Zhen Li has described the medicinal value of ricefield eel in treatment of human diseases in his famous pharmacy monograph, the Bencao Gangmu, also called “Compendium of Materia Medica” (Cheng and Zhou, 2022). Nowadays, ricefield eel has been developed as one of the most important economical fish in freshwater aquaculture in China, with annual production exceeding 300,000 tons (Song et al., 2022). Unfortunately, the population has declined rapidly in the wild due to degradation of natural environment and human activity such as overfishing. The reproductive mode of ricefield eel, which leads to much more females than males in spawning season, severely affects the sex ratio, and decreases the productivity of broodstock. Moreover, adult females lay limited eggs (∼200) due to its small size, which is a limiting factor for massive production of seedling for aquaculture industry. Thus, the elucidation of the mechanisms underlying the sex change/sex determination is urgent, which will aid in developing strategies/techniques for sex control that would break the bottleneck in aquaculture industry (Wu et al., 2019).The life history of ricefield eel implies that environmental factors initiate and promote the gonadal transformation via epigenetic mechanisms. Consistently, histone demethyltransfearse/methyltransfearse genes such as kdm6b/kmt2 and DNA methylation enzyme genes such as dnmt1/3 were dynamically expressed throughout the sex change process, and the expression levels of the master sex determination/differentiation genes are closely correlated to the levels of DNA and histone methylation, which can be impacted by environmental exposure (Fan et al., 2021, 2022; Jiang et al., 2021; 2022; Hu et al., 2022; Wang et al., 2020). However, these epigenetic regulators are not inherently responsive to the environmental cues, implying that certain molecular sensors exist and serve as the link between environmental stimuli and the sex determination pathway. We have recently proposed that there is a temperature-induced sex reversal (TISR) mechanism in ricefield eel (Zhang et al., 2025), similar to that of embryonic bearded dragon (P. Vitticeps) (Whiteley et al., 2018). Importantly, isolated ovarian explants are responsive to temperature stimuli, suggesting that the perception of temperature is executed by certain sensors expressed in ovarian cells.While preliminary data have suggested that the Ca2+-permeable, non-selective cation channel Trpv4 (Transient Receptor Potential Vanilloid 4 channel) might be a potential thermosensor, how Trpv4-regulated signals are transduced into the sex determination cascades remains unclear (Zhang et al., 2025). Recent studies have shown that signal transducer and activator of transcription 3 (STAT3) is phosphorylated by warm temperature-evoked Ca2+ influx, and then binds and transcriptionally regulates kdm6b, thereby initiating the female pathway by repressing the male sex determination gene dmrt1 (Weber et al., 2020). In this work, we hypothesized that ricefield eel Trpv4 may bridge environmental temperature and the sex differentiation pathway. By using small molecule agonist and antagonist of Trpv4 as well as siRNA-mediated knockdown of trpv4, we provided solid evidences that temperature-evoked Trpv4 activity promotes the sex change of ricefield eel via the downstream Ca2+-pStat3-Kdm6b axis.ResultsWarm temperature promotes gonadal transformationNatural populations of ricefield eel are mainly distributed across East and Southeast Asia. Previous studies have reported that at the onset of sex change, wild fish from different geographic populations and habitats vary in age, body weight and length. For instance, it is around 16 cm long (18-month-old) in Bandung area of Indonesia (Liem, 1963), and ∼20 cm in Hainan and Guangzhou areas of southern China (Chan and Philips, 1967; Wang and Zeng, 2006), ∼30 cm (2-year-old) in Wuhan area of central China (Wang et al., 2008), and 35-40 cm (3-year-old) in Tianjin area of northern China (Fan et al., 2017; 2021; Liu and Wang, 1987). The average annual temperature in Hainan, Guangzhou, Wuhan and Tianjin areas is approximately 25, 22, 17, and 13 °C, respectively (Figure 1A). This observation implied that higher temperature facilitates the sex change of ricefield eel. To directly investigate this, during June-July, 2024, we have obtained ∼200 2-year-old wild ricefield eels from the southernmost Hainan and central Wuhan, and examined their gonads. We found that less than 5% of the fish from Wuhan area were intersex animals, whereas approximately 24% of the fish from Hainan area were in intersex stage (Figure 1B).Figure 1.Warm temperature promotes gonadal transformation in ricefield eel.(A) The distribution of 4 geographic populations of ricefield eels in China, showing the average annual temperature of each. (B) Bar graph showing the percentage of intersex animals in 2-year-old wild-caught ricefield eels from Hainan (Hainan province) and Wuhan area (Hubei Province). n=200 for each group. (C) Diagram showing the design of long term temperature experiments. Two temperatures were used: 25 °C (cool temperature), 33 °C (warm temperature). n=400 for each group. (D) Representative H&E staining images showing the gonad types of animals that were reared at cool and warm temperatures at the indicated time points. Bar: 200 µm. (E) Bar graph showing the percentage of intersex animals after 180 days of cool and warm temperature treatment. The experiments were repeated at least two times.In Wuhan area (Hubei province, China), the reproductive season of wild ricefield eel usually runs from May to August, when the average monthly temperature is 25-33 °C (Figure S1A). Immediately after spawning, the females (2-year-old) may undergo extensive ovarian tissue degeneration and physiological change (Liu and Gu, 1950), which leads to an irreversible commitment to becoming male via an intersex stage (Figures S1B-C). This observation again supported that the onset of sex change of ricefield eels is closely related to the external environment, in particular the warm temperature.The above observations prompted us to hypothesize that warm temperature plays an important role in driving the sex change of ricefield eel. To directly test this, long term temperature experiments were performed using females from Wuhan Area (Figure 1C). One-and-a-half-year-old females (about 50 g) were randomly divided into two groups, and reared at 25/26 °C (cool temperatures, CT) and 33/34 °C (warm temperatures, WT), for a period of 6 months. At day 30, 90, and 180, the gonadal sex of randomly selected fish from different group was determined by H&E staining and expression analysis of sex-biased genes (Figure 1D). The average body length and weight of ricefield eels were comparable between the WT group and the CT group (Figures S1D-E). In CT group at day 90, ∼90% gonads were ovaries, and ∼10% were ovotestes. In WT group, however, ∼65% gonads were ovaries, and ∼35% were ovotestes (Figure 1E). In CT group at day 180, ∼80% gonads were ovaries, and ∼20% were ovotestes. In WT group, however, ∼25% gonads were ovaries, and ∼75% were ovotestes (Figure 1E). We concluded that warm temperature promotes gonadal transformation of ricefield eel.Trpv4 is highly responding to environmental temperatureWe went on to investigate how the gonadal tissues are responding to temperature cues. Previous work has suggested that Trpv4 associates environmental temperature and sex determination in TSD alligator and ricefield eel (Huang et al., 2024; Yatsu et al., 2015; Zhang et al., 2025). We hypothesized that ricefield eel Trpv4 is expressed in ovary and functions as a thermosensor that perceives/detects the environmental temperature cues. The results of qPCR experiments showed that trpv4 was higher expressed in gonadal tissues than in non-gonadal tissues, exhibiting the highest expression in testis (Figure 2A). RNA in situ hybridization (ISH) experiments confirmed that trpv4 levels increased from ovary to testis (Figure 2B), implying that it was functionally associated with testicular development.Figure 2.trpv4 is highly responding to environmental temperatures.(A) Relative expression levels of trpv4 in 10 different tissues in adult ricefield eels. B: brain, H: heart, E: eye, K: kidney, S: spleen, L: liver, M:muscle, O: ovary, OT: ovotestis, T: testis. n=3. (B) ISH images showing trpv4 expression in ovaries, ovotestes, and testes. Black arrows pointing to trpv4 expressing cells. Bar: 200 µm. (C) The expression of the indicated trp and sex-biased genes of in vitro cultured ovaries at cool and warm temperatures. n=5 per group. (D) qPCR results showing the expression patterns of trpv4 and male sex genes in repeated temperature shifting experiments of in vitro cultured ovaries. n=5 per group. (E) Confocal images showing the calcium signaling in cultured ovarian cells at the indicated conditions. After shifting to 34 °C for 2 h, Cal-520 was added and calcium signal imaging was performed. The Trpv4 agonist GSK1016970A and antagonist RN1734 were administrated in the culture medium, and 2 h later, calcium signal imaging was performed. Bar: 100 µm. (F) qPCR results showing the dynamic expression of the indicated genes in gonads of female ricefield eel at 25 °C, and at the indicated time points after shifting to 34 °C. day 1: day 1 after shifting to 34 °C. n=5 per group. (G) ISH images showing the dynamic expression of trpv4 at the indicated time points before and after shifting to 34 °C. At 25 °C, trpv4 was moderately expressed in follicles of various stages of developing oocytes, and interstitial cell types. After shifting to 34 °C, trpv4 signals became much stronger compared to 25 °C. Bar: 200 µm. (H) Representative IF images showing the co-localization of Trpv4– and Foxl2-expressing cells. Bar: 50 µm. n=10. *: P< 0.05, **: P< 0.01, ***: P< 0.001, and ****: P< 0.0001. ns: not significant. All experiments were repeated at least three times.In cultured primary ovarian explants, trpv4 was one of the most up-regulated trp genes induced by warm temperature (Figure 2C). Temperature-shifting experiments showed that trpv4 was highly sensitive to temperature cues (Figure 2D), displaying a pattern similar to the testicular differentiation genes such as dmrt1/sox9a, but inverse to that of the ovarian differentiation genes such as cyp19a1a/foxl2 (Figure S2A). trpv4 was elevated as early as 4 hours post warm temperature treatment (Figure S2B), suggesting that it was an early temperature-response gene. The trpv4 gene encodes a constitutively active Ca2+-permeable cation channel that can be activated by warm temperature (Güler et al., 2002). Consistently, when Ca2+ indicator Cal-520 was added in the cells, a significant increase in the calcium signal was observed at 34 °C in comparison to 26 °C (Figure 2E), which suggested that Ca2+ signaling mediates the temperature-controlled Trpv4 activity, similar to the embryonic dragon (Whiteley et al., 2021). This was further supported by our RNA-seq data that trpv4 and many genes involved in Ca2+ transport and sequestration were up-regulated in ovotestes compared to ovaries (Zhang et al., 2025).While trpv4 is highly responding to temperature changes in cultured ovarian cells, it is not known whether this was the case in vivo. To explore this, female fish were transiently reared at cool temperature (25 °C) for 1 day, and then shifted to warm temperature (34 °C) for 10 days. trpv4 mRNA in ovaries was already elevated on day 1 after shifting to 34 °C (Figure S2C), and its levels progressively increased over time, exhibiting a pattern similar to that of testicular differentiation genes (Figure 2F).To understand in more detail of the role of trpv4, we studied its expression pattern in ovaries by performing ISH (mRNA in situ hybridization) experiment. The ISH results showed that trpv4 was moderately detected in ovarian somatic cells around the oocytes at cool temperature (Figure 2G). Warm temperature exposure led to an increase of trpv4 gene expression in ovarian follicles of different developmental stages, and its levels were positively correlated with the duration of temperature exposure. To explore the identity of the Trpv4-expressing follicle cells, double immunofluorescence (IF) experiments were performed using antibodies against Trpv4 and Foxl2, a granulosa cell marker. The IF results showed that Trpv4 protein was expressed in a portion of Foxl2-positive granulosa cells (Figure 2H). The observation suggested that these trpv4-expressing somatic cells in ovary may play an important role in gonadal transformation in response to warm temperature.Temperature-induced male gene expression depends on Trpv4The co-expression of trpv4 and testicular differentiation genes prompted us to ask whether the thermosensor Trpv4 in ovaries function to transduce the temperature cues into the sex determination cascades. To investigate this, animal experiments were performed by injecting into ovaries with small molecules RN1734 and GSK1016790A, known Trpv4 specific antagonist and agonist, respectively (Liu et al., 2021). The experimental females were reared and divided into 4 groups based on the combination of temperatures and the injected small molecules: 25 °C+ DMSO; 25 °C+ GSK1016790A; 34 °C+ DMSO; 34 °C+ RN1734 (Figure 3A). 3-10 days post injection, the gonads were isolated and used for the subsequent analyses.Figure 3.Warm temperature-induced male gene expression depends on Trpv4.(A) Cartoon showing the design of animal experiments. Female eels kept at cool (25 °C) and warm (34 °C) temperatures were injected with the Trpv4 agonist GSK1016790A and antagonist RN1734 into the ovaries, respectively. After 2-3 days of injection, the ovaries were isolated and processed for the subsequent experiments. n=40. (B) qPCR results showing the relative expression levels of the sex-biased genes at the indicated conditions, based on the animal experiments. n=5 per group. (C) Representative WB images showing the expression of the indicated markers at the indicated conditions. GSK: GSK1016790A. (D) Relative quantification of the indicated proteins in Panel C. WB were repeated 3 times. (E) Representative IF images showing the expression of the indicated markers at the indicated conditions. Vimentin was used for show all cell types in ovaries. GSK: GSK1016790A. Bar: 200 µm. n=10, and 9/10 showed induced expression of Dmrt1/Sox9a. (F) quantification of panel E. *: P< 0.05, **: P< 0.01, ***: P< 0.001, and ****: P< 0.0001. ns: not significant. All experiments were repeated at least three times.The qPCR results showed that compared to the cool temperature group, warm temperature exposure increased the expression of testicular differentiation genes, accompanied by moderately decreased expression of ovarian differentiation genes (Figure 3B). Injection of 10 µM RN1734 blocked the up-regulation of testicular differentiation genes by warm temperature treatment, whereas injection of 0.1 µM GSK1016790A at 25 °C was sufficient to induce the expression of testicular differentiation genes to an extent similar to warm temperature treatment, at the expense of ovarian differentiation genes. The effects of small molecules on gene expression were dose dependent (Figure S3A). Similar results were observed at the protein levels, as revealed by Western blot (WB) and IF experiments (Figures 3C-F). We also repeated the experiments using cultured ovarian explants and/or cells, which produced similar results (Figures S3B-F). Moreover, activation and inhibition of Trpv4 ion channel function by the small molecules was correlated with increased and decreased calcium signaling, respectively (Figure 2E).The above data suggested that Trpv4 is sufficient and necessary to induce the expression of testicular differentiation genes in ovaries, via its ion channel function. To further demonstrate this, trpv4 siRNA was injected into the ovaries. trpv4 expression was markedly down-regulated by 0.1 µM siRNA injection (Figure 4A). Importantly, siRNA injection led to a marked decrease in expression of testicular differentiation genes that were up-regulated by warm temperature exposure, and a slight increase in expression of ovarian differentiation genes that were repressed by warm temperature treatment. Similar results were observed at the protein levels as revealed by WB experiments (Figures 4B-C). We concluded that warm temperature-induced male gene expression is dependent on Trpv4 activity.Figure 4.siRNA-mediated trpv4 knockdown abolishes the abnormal up-regulation of male genes by warm temperature treatment.(A) qPCR results showing the relative expression of the indicated genes at the indicated conditions in animal experiments. (B) Representative WB images showing the expression of sex biased proteins at the indicated conditions in animal experiments. (C) Quantification of panel B. (D) qPCR results showing the relative expression of the indicated genes at the indicated conditions. 10 µM RN1734 and DMSO was injected into gonads of male fish reared at 25/26 °C. Female fish injected with DMSO were used as control. *: P< 0.05, **: P< 0.01, ***: P< 0.001, and ****: P< 0.0001. ns: not significant. All experiments were repeated at least three times.Next, we evaluated the effect of Trpv4 inhibition in testes of male adults. To this end, 10 µM RN1734 was injected into gonads of male fish reared at 25 °C, and qPCR was performed to assess the expression of female– and male pathway genes. The results showed that Trpv4 inhibition by RN1734 treatment led to an increase in the expression of ovarian differentiation genes in testes, at the expense of testicular differentiation genes (Figure 4D). The results suggested that Trpv4 activity is persistently required for the expression of testicular differentiation genes in male gonad.pStat3 signaling is downstream of Trpv4We next asked how Trpv4-controlled Ca2+ flux was interpreted and transduced into the sex determination cascades. In TSD turtles and TISR central bearded dragon, Stat3/4 are activated through phosphorylation by temperature-evoked calcium signaling, and is directly involved in sex determination (Weber et al., 2020; Whiteley et al., 2021). Based on our RNA-seq data, we found that stat3, and the Jak/Stat3 pathway target genes such as socs3 and egr1/2, were significantly up-regulated in early ovotestes compared to ovaries (Figure 5A). We therefore hypothesized that pStat3 signaling is downstream of Trpv4-contolled calcium influx to promote the expression of male pathway genes in ovaries. In fact, several lines of evidences were in favor of this hypothesis. First, activation of Trpv4 ion channel by GSK1016790A at cool temperature led to elevated pStat3 levels and calcium signals in ovarian explants, similar to that by higher temperature treatment, and inhibition of Trpv4 ion channel by RN1734 at warm temperature decreased pStat3 levels and calcium signals (Figures 5B-D). Second, pStat3 signals were detected in the gonadal somatic cells around the oocytes and interstitial cells, analogous to that of trpv4 (Figure 5B; Figure 2G). Third, the levels of pStat3 were gradually increased from ovaries to testes in wild-caught ricefield eels, along with the male sex promoting factors such as Amh (Figures 5E-F; Figure S5A-B). Fourth, WB blot analysis of A23187– or BAPTA-AM-treated ovarian cells showed that exposure to the ionophore A23187 increased phosphorylation levels of Stat3 at 25 °C, whereas chelatin of calcium with BAPTA-AM led to diminished activation of Stat3 (Figures 5G-H). Collectively, these observations strongly suggested that Trpv4 cell autonomously controls phosphorylation of Stat3 via the regulation of calcium signal in gonadal somatic cells. To explore the function of the pStat3 signaling, animal experiments were performed by injecting into ovaries with small molecules HO-3867 or Colivelin. HO-3867, a curcumin analogue, is a selective pStat3 inhibitor, which blocks pStat3 activity by directly binding to Stat3 DNA binding domain, and Colivelin is a potent synthetic peptide activator of pStat3, which increases pStat3 levels by acting through the GP130/IL6ST complex (Wu et al., 2024). The injected females were divided into 4 groups based on the temperatures and the small molecules injected: 25 °C+ DMSO; 25 °C+ Colivelin; 34 °C+ DMSO; 34 °C+ HO-3867 (Figure 6A). 3-10 days post injection (dpj), the ovaries were isolated and subjected to the subsequent analyses. Injection of HO-3867 blocked the up-regulation of testicular differentiation genes by warm temperature exposure, whereas injection of Colivelin at 25 °C was sufficient to induce the expression of these genes to an extent similar to warm temperature treatment, at the expense of ovarian differentiation genes (Figures 6B). Similar results were observed at the protein levels as revealed by IF experiments (Figures 6C-D). We also repeated the experiments using ovarian explants and/or cells, which produced similar results (Figure S5A-B).Figure 5.The JAK/Stat3 signaling is downstream of Trpv4.(A) Heat map showing the expression of the indicated genes of different groups. (B) IF images showing the expression of pStat3 at the indicated conditions in animal experiments. The white arrows indicated the location of pStat3 expressing cells. The experiments were repeated at least two times. Bar: 200 µm. n=12, and 10/12 showed increased expression of pStat3. (C) Quantification of panel B. (D) Bar graph showing the relative calcium signals at the indicated conditions. Ovarian explants were cultured at the indicated conditions, and calcium signals were determined by calcium indicator dye Cal-520 acetoxymethyl ester. (E) Representative WB images showing the expression of the indicated makers in ovaries, early ovotestes, and middle ovotestes. n=5 per group. (F) Quantification of panel E for relative expression of Amh and pStat3. (G) pStat3 levels after the addition of A23187 and BAPTA-AM in cultured ovarian cells at 25 °C and 34 °C conditions. (H) Quantification of panel G. All experiments were repeated at least two times.Figure 6.Animal experiments showing that warm temperature induced male gene expression depends on pStat3.(A) Cartoon showing the design of the experiments. Female eels kept at cool (25 °C) and warm (34 °C) temperatures were injected with the pStat3 agonist Colivelin and antagonist HO3867 into the ovaries, respectively. After 2-3 days of injection, the ovaries were isolated and processed for the subsequent experiments. n=50. (B) qPCR results showing the relative expression of the indicated genes at the indicated conditions. n=5 per group. (C) IF images showing the expression of male biased genes at the indicated conditions. Bar: 200 µm. n=10, and 8/10 showed increased expression of pStat3/Dmrt1. (D) Quantification of panel C. n=5 per group. (E) qPCR results showing the relative expression of the indicated genes at the indicated conditions. n=5 per group. (F) qPCR results showing the relative expression of the indicated genes at the indicated conditions. n=5 per group. *: P< 0.05, **: P< 0.01, ***: P< 0.001, and ****: P< 0.0001. ns: not significant. The qPCR experiments were repeated at least three times.To functionally demonstrate that pStat3 signaling is downstream of Trpv4, rescue experiments were performed by injecting into ovaries with individual and combined small molecules. The females were divided into 6 groups based on the temperatures and the small molecules injected: 25 °C+ DMSO; 25 °C+ GSK1016790A; 25 °C+ GSK1016790A+HO-3867; 34 °C+ DMSO; 34 °C+ RN1734; 34 °C+ RN1734+ Colivelin. 3-5 days post injection, the ovaries were isolated and subjected to the qPCR analysis. The results showed that mRNA up-regulation of testicular differentiation genes by the administration of Trpv4 agonist at 25 °C was abolished by the treatment with pStat3 inhibitor, and that expression of testicular differentiation genes inhibited by Trpv4 antagonist treatment at 34 °C can be partially restored by the injection with pStat3 agonist (Figure 6E). Similar results were obtained using in vitro cultured ovarian explants (Figure S6C).To further confirm that Trpv4 functions upstream of pStat3, Trpv4 agonist GSK1016790A and stat3 siRNA were simultaneously injected into the ovaries of fish reared at 25 °C, and the expression of sex-biased genes was examined by qPCR analysis. The results showed that the testicular differentiating genes failed to be activated by GSK1016790A in the presence of stat3 siRNAs (Figure 6F). Taken together, we concluded that Trpv4 promotes male sex gene expression in ovaries via the activation of the downstream pStat3 signaling.pStat3 binds and activates kdm6bKdm6b is known a conserved activator at the top of the male sex determination pathway, via binding and activating dmrt1 through removing the repressive histone mark H3K27me3 (Chen et al., 2024; Dupont et al., 2025; Ge et al, 2018; Lu et al., 2025; Yao et al;, 2024), and pStat3 can transcriptionally activate the kdm6b gene by directly binding to its upstream DNA motifs in reptiles (Wu et al., 2024; Weber et al., 2020). We reasoned that pStat3 had a similar function in ricefield eel. When analyzing –5 kb promoter sequences upstream the TSS of the kdm6b gene, we found that there were three conserved pStat3 binding sites (TTCnnnGAA) (Figure 7A). Chromatin immunoprecipitation (ChIP) experiments using pStat3 antibodies showed that pStat3 levels were significantly higher at kdm6b promoter in ovaries of females reared at warm temperature than at cool temperature, which was abolished in the presence of pStat3 inhibitor HO-3867 (Figure 7B). To explore whether pStat3 directly activates kdm6b, luciferase assay was performed. pGL4-kdm6b-luc construct was constructed by cloning ∼3.5 kb kdm6b promoter sequences into the pGL4-luc plasmid. A mutant construct (pGL4-kdm6bM-luc) was generated by replacement of “TTCAGAGAA” with “TTAAAAGAA”. pGL4-kdm6b-luc and pGL4-kdm6bM-luc were transfected with into HEK293T cells in the presence and absence of pStat3 agonist Colivelin, and the luciferase activities were measured. The results showed that activities of pGL4-kdm6b-luc were significantly higher than that of pGL4-kdm6bM-luc in the presence of Colivelin (Figure 7C).Figure 7.pStat3 binds and activates the kdm6b gene.(A) Cartoon showing the conserved pStat3 binding motifs upstream the TSS of the kdm6b gene. (B) ChIP experiments showing the enrichment of pStat3 at the kdm6b locus in ovarian tissues of fish reared at cool temperature (CT) and warm temperature (WT) conditions, in the absence and presence of HO-3867. (C) Luciferase assay for kdm6b-luc and kdm6bM-luc activities in 293T cells, in the absence and presence of pStat3 agonist Colivelin. (D) The representative ISH images showing the expression of kdm6b in ovary and testis. Bar: 200 µm. n=3 per group. (E) Cartoon showing how Trpv4 may link environmental temperature to the sex determination cascades via the downstream signaling pathways in ricefield eel. *: P< 0.05, **: P< 0.01, ***: P< 0.001, and ****: P< 0.0001. ns: not significant. ChIP and Luciferase experiments were repeated two times.kdm6b mRNA was expressed in immature oocytes in ovaries, was induced by warm temperature exposure, and higher expressed in testes than in ovaries in ricefield eel (Figure S2C; Figure S3B; Figure S5A; Figure 6B; Figure 7D), analogous to that of trpv4. The expression of kdm6b was elevated by the injection (animal experiments) or addition (cell culture experiments) of GSK1016790A or Colivelin at 25 °C, and was down-regulated by the injection or addition of RN1734 or HO-3867 at 34 °C (Figure 3B; Figure 6B; Figure S3B; Figure S5A). Thus, the kdm6b gene displayed an expression pattern similar to that of the testicular differentiation genes, which strongly supported that kdm6b is a male pathway gene downstream of Trpv4-Ca2+-pStat3.If kdm6b is downstream of Trpv4-pStat3 to regulate the expression of dmrt1, inhibition Kdm6b demethyltransferase activity should prevent up-regulation of testicular differentiation genes by warm temperature treatment, similar to HO-3867 and RN1734 treatment. 0.5 µM GSK-J4, an Kdm6b specific inhibitor, was injected into the ovaries of ricefield eel, and the expression of sex-biased factors were examined by the qPCR and IF analyses. The results showed that GSK-J4 injection significantly down-regulated the expression of testicular differentiation factors at the expense of ovarian differentiation factors (Figures 6B-D). Similar results were obtained in cultured ovarian cells (Figures S5A). We propose that there exists a Trpv4-pStat3-Kdm6b axis that links the environmental temperature and the male sex determination pathway (Figure 7E).DiscussionSince the first discover that ricefield eel is a teleost fish of hermaphroditism (Liu et al. 1944), the underlying mechanism has been under intensive investigation. However, it is still mysterious, partially because it is challenging to perform genetic studies due to unique reproductive strategy and life history of the species (Song et al., 2022). In this work, we provided solid evidences that warm temperature promotes the sex change of adult ricefield eel, and that the ion channel protein Trpv4 functions as an important molecular linker connecting the environmental temperature and the sex determination pathway. Our results support a model in which temperature-driven sex change is achieved via the Trpv4-pStat3-Kdm6b-Dmrt1 axis. In this model, warm temperature exposure leads to increased calcium influx via Trpv4, which promotes phosphorylation of pStat3 and expression of the male pathway genes such as kdm6b/dmrt1 in the ovary, eventually and gradually resulting in transformation of ovary to testis via an ovotestis. Our work for the first time provides the mechanistic explanation of how natural sex change occurs in aging ricefield eel, which may serve as a paradigm to study natural sex change of other adult animals, including the hermaphroditic marine fish.The initial perception and translation of environmental cues into the sex determination cascades remain unclear in any species. Previous studies have proposed endoplasmic reticulum chaperone, heat shock proteins and transmembrane ion channels, as potential temperature sensors (He et al., 2010; Shi et al., 2024). In contrast to Cdc2-like kinases (Clks) that response to subtle temperature change in homeothermic organisms, the transient receptor potential (TRP) cation channels may play important roles in poikilothermic animals that are exposed to strong ambient temperature change (Haltenhof et al., 2020; Huang et al., 2024). The TRP channel family can be divided into at least seven subfamilies, including TRPA, TRPC, TRPM, TRPML, TRPN, TRPP and TRPV. The thermo-TRPs contain nine members, such as TRPV (TRPV1-4). TRPV1-3 are mainly activated by temperatures above 35 °C, respectively (Mo et al., 2022). Of note, TRPV4 is activated by warm temperatures (27-35 °C) (Goikoetxea et al., 2021; Güler et al., 2002; Fujita et al., 2017), which are physiologically relevant to the spawning and/or initiation of sex change of ricefield eel. Trpv4 has been shown to be abundantly expressed during testicular/sperm development (Kumar et al., 2016; Mundt et al., 2018). Activation of Trpv4 by various endogenous/exodogenous stimuli increases Ca2+ influx, participating in multiple downstream biological events, including gonadal cell apoptosis (Guler et al., 2002; Liu et al., 2021; Luo et al., 2023; Vrenken et al., 2016; Yamamoto et al., 2024). Importantly, Trpv4 has been shown to associate temperature and sex determination in TSD alligator, and pharmaceutical activation and inhibition of Trpv4 alters testis differentiation (Yatsu et al., 2015). In ricefield eel, trpv4 was one of the most up-regulated trp genes by warm temperature treatment, and its expression was associated with testicular development. Thus, we focused on the role of Trpv4 in this work. Based on in vitro and in vivo experiments, we demonstrated that a portion of Trpv4 expressing gonadal somatic cells are highly sensitive to temperature cues and are functionally important in temperature-driven sex change of ricefield eel.We provided evidences that the pStat3 signaling is downstream of and mediates Trpv4. Previous work in the red-eared slider turtle (Trachemys scripta elegans) and the bluehead wrasse (Thalassoma bifasciatum) has indicated that Stat3 phosphorylation and epigenetic regulation are involved in TSD or sex change (Todd et al., 2019). pStat3 is likely to be involved in sex determination by transcriptionally activating the female pathway genes such as foxl2 and/or repressing the male pathways genes such as kdm6b (Chen et al., 2024; Deveson et al., 2017; Ge et al., 2018; Holleley et al., 2015; Weber et al., 2020; Wu et al., 2024). The function of jmjd3/kdm6b in male sex determination in embryonic TISR/TSD animals has been well established (Chen et al., 2024; Ge et al., 2018; Yao et al., 2023). Overexpression and knockdown of kdm6b cause female to male or male to female sex reversal, respectively. In this work, increased expression of testicular differentiation genes preceded the down-regulation of ovarian differentiation genes, suggesting that the male pathway genes were more directly regulated during sex change of ricefield eel. Our ChIP and luciferase reporter experiments suggested that pStat3 directly binds and activates the kdm6b gene. Whether pStat3 regulates female genes such as foxl2 awaits further investigation. In turtles, pStat3 functions as a repressor of kdm6b (Weber et al., 2020), whereas in ricefield eel and the bluehead wrasse, pStat3 may function as an activator of kdm6b (Todd et al., 2019). We propose that a yet-unidentified co-factor may determine whether pStat3 is a transcriptional repressor or activator. Nevertheless, a conserved Trpv4-pStat3-Kdm6 axis may play an important role in sex determination/differentiation in TSD/GSD+ TE reptiles and fish. In the future, it will be interesting to investigate whether this is the case using other TISR/TSD models.Trpv4, pStat3 and Kdm6b were expressed in somatic cells surrounding ovarian oocytes and interstitial cells. After warm temperature exposure, their levels were elevated over time, similar to that of the testicular differentiation genes. We propose that the magnitude and duration of temperature exposure promote sex change of ricefield eel by driving the accumulation of testicular differentiation genes in sufficient quantities (Weber et al., 2020). In sex reversal animals, a long existing question is what cells in the gonad respond to environmental temperatures to initiate sex change. In groupers such as Epinephelus akaara, certain pre-existing somatic cells, called testicular-inducing steroidogenic cells, trigger the sex change (Murata et al., 2021). Recently, it has been proposed that a group of Nr5a1+Trp− thermosensitive steroidogenic cells use temperature-dependent Ca2+ signals to transduce into the male sex determination pathway in turtles (Li et al., 2025; Ye et al., 2025). Here, we showed that in ricefield eel, a portion of Trpv4-expressing granulosa cells in ovary are responding to temperature change, and may play an important role in triggering the sex reversal. Dmrt1 expression showed up within follicles in a typical granulosa cell location (Figure 3E; 6C). We propose that warm temperature exposure may cell-autonomously reprogram of a portion of Trpv4+ granulosa cells into Dmrt1/Sox9a-positive Sertoli precursor cells, thereby promoting the sex change of ricefield eel.To summary, this study used ricefield eel hermaphrodite to elucidate the molecular basis underlying the transduction of environmental temperature into an intracellular signal for sex determination. We have made a few important findings. First, the ovarian somatic cells in ricefield eel are highly responding to the warm temperature. Warm temperature is sufficient to induce the expression of testicular differentiation genes, without input of other factors such as hormones. Second, we identified a group of Trpv4-expressing granulosa cells that can directly perceive and respond to ambient temperature changes. Third, the pStat3-Kdm6b-dmrt1 axis is downstream and mediates temperature-evoked Trpv4 activation. Our work revealed a comprehensive TISR mechanism, which involves signals that initiate sex reversal (temperature) and the capture (Trpv4), sensing (Trpv4-controlled calcium influx), transduction and interpretation (the Jak/Stat3 pathway) of environmental signals into the sex determination pathway (kdm6b/dmrt1). Of course, this work has limitations. Due to the unique life history of ricefield eel, genetic evidences are not sufficiently provided to substantiate the conclusion. Direct evidences for Trpv4 control of Ca2+ signaling are lacking. Whether and how Trpv4-positive granulosa cells transdifferentiate into Dmrt1-positive Sertoli precursors during sex change awaits further investigation.Materials and MethodsResource availabilityLead contactFurther information and requests for resources and reagents should be directed to and will be fulfilled by the lead contact, Yuhua Sun (sunyh@ihb.ac.cn).Materials availabilityAll antibodies and plasmids generated in this study are available from the lead contact.Sampling and maintenance of ricefield eelRicefield eel were purchased from the Baishazhou market, Wuhan, China. They were temporarily maintained in the lab at 25±1 °C under a 14-h light/10-h dark cycle, and fed daily with commercial diet. Female fish were usually less than 40 cm in length, males were more than 50 cm in length, and intersex animals were of medium length.Animal experiments and treatments were performed according to the Guide for Animal Care and Use Committee of the Institute of Hydrobiology, Chinese Academy of Sciences (IHB, CAS, Protocol No. 2016-018).RNA preparation and RNA-sequencingWe have performed RNA-sequencing (RNA-seq) experiments using gonadal tissues from female, middle-late intersex, and male animals (Zhang et al., 2025). To explore the earliest events that trigger the onset of sex change of ricefield eel, gonads from female, early intersex, and middle intersex animals were isolated. Each gonad was examined by color and morphology, and in some cases histological experiments were performed to confirm the gonadal identities. Two to three gonads from each group were pooled, and total RNAs were isolated using a TRIzol reagent (ThermoScientific, USA). RNA sample quality was checked by the OD 260/280 ratio using a Nanodrop 2000. The total mRNAs were sent to the BGI (Beijing Genomics Institute) company (ShenZhen, China), where RNA-sequencing libraries were constructed and sequenced by a BGI-500 system. RNA-seq experiments were performed at least two times, with two technical repeats.Quantitative real-time PCR (qPCR) experimentsTotal RNA was isolated using the Isolation Kit mRNA. dmrt1/sox9a were used as male-specific genes, and cyp19a1a/foxl2 were used as female-specific genes. The primers and the related information used in this work were listed in Table S2. qPCR analysis was used to determine gene expression levels. A total of 1 µg RNA was reverse transcribed into cDNAs using the TransScript All-in-One First-Strand cDNA synthesis Supermix (Transgen Biotech, China, AT341). qPCR amplification was carried out on a Bio-Rad CFX96 Touch Real-Time PCR System (Bio-Rad, Hercules, CA, USA) in triplicate. The reaction mixture consisted of 5 µL PerfectStart™ Green qPCR SuperMix (Transgen Biotech, China), 3.6 µL ddH2O, 0.2 µL forward and reverse primers, and 1 µL cDNA. The cycling parameters used were 94 °C for 30 s, 94 °C for 5 s, 60 °C for 15 s, and 72 °C for 10 s for 40 cycles. Quantification cycle or cycle threshold values were determined using CFX Manager 3.1 (Bio-Rad, USA). Primers were 20-21 nucleotides long, with a melting temperature between 58 and 60 °C and a guanine-cytosine content between 50% and 60% generating an amplicon of 80-200 bp. Beta-actin was used as a reference gene. All qPCR experiments were repeated three times, and the relative gene expression levels were calculated based on the 2−ΔΔCt method.siRNA knockdown experimentsTo study in vivo function of Trpv4, we used siRNA to deplete the expression of the trpv4 gene. The sequences of the ricefield eel trpv4 gene (Accession Number: NW_018127903.1) were obtained from NCBI GenBank. The siRNA sequences are list in Table S2. These siRNAs were purchased from Sangon Biotech (Shanghai, China). Eighteen female fish were equally divided into 3 groups: 25 °C+ MOCK; 34 °C+ MOCK; 34 °C+ trpv4-siRNA. For the 34 °C-group setting, after 1-2 day of acclimation at 25 °C, the temperature of water was gradually increased by 3 °C per day until reaching to 34 °C. For RNAi experiment, before increasing the temperatures, the siRNA was injected into ovaries through genital papilla. siRNAs were injected twice, for an interval of 2 days. Three trpv4-siRNAs were mixed in equal amounts; each fish was injected with 100 nM/kg. The MOCK groups were injected with equal amounts of control siRNAs. Two days after the second siRNA injection, ovarian samples were processed for qPCR analysis, and/or cryopreserved for ISH.WB analysisWB was performed as previously described (Sun et al., 2020; 2023). The antibodies used in this work were: Amh (Huabio, #HA500137, China), Dmrt1 (home-made), Sox9a (home-made), Foxl2 (Thermofisher, #PA1-802, USA), Stat3 (Cell signaling, #9139, USA), pStat3 (Cell Signaling, #9145, USA). For animal experiments, the fish were reared for additional 3-5 days for the detection of protein of interest. To validate the specificity of the antibodies, siRNA-mediated knockdown with immunoblot quantification with at least 2 replicates were performed.IF experimentsAnesthetic fish were fixed with 4% PFA, and gonads were isolated. The gonads were washed three times with PBS and dehydrated in sucrose solution (15% sucrose/PBS, 30% sucrose/PBS) for 2 h at 4 °C. Gonads were mounted in Tissue-Tek OCT compound (#4583, Sakura) and sectioned to 30 µm thickness on a cryostat. Slides containing sections were dried at room temperature for 30 min and washed 3 times for 5 min at room temperature with PBS. Sections on slides were blocked using 5% normal bovine serum (#A2153, Sigma Life Science) in PBS + 0.1% Triton-X100 (#V900502, VETEC) for 2 h. After wash, Primary antibodies, including Amh (Huabio, China), Foxl2 (ab5096, abcam), Trpv4 (Huabio, ER65407, China), Dmrt1 (home-made), Sox9a (home-made), Vimentin (OMA1-06001, Thermofisher, USA), were added at dilution of 1: 1000. Slides were washed 3 times with PBS for 5 min, followed by incubation in Alexa 488 or Alexa 555 (#A11008/A21428, Thermofisher, USA) secondary antibodies (1: 500) for 2 h. The samples were counter-stained with DAPI (#D9542, Sigma, 1:1000) in 1×PBS at room temperature for 1 h. After 3 times washing with PBS, slides were mounted using an anti-fade mounting medium (#HY-K1042, MedChemExpress, China). Mounted slides were imaged with a Leica Confocal Microscope (TCS SP8 STED, Germany).In situ hybridization (ISH)To detect the expression of trpv4/kdm6b in the gonads, ISH experiments were performed. The cDNAs of ricefield eel trpv4 and kdm6b were amplified by gene specific primers trpv4-SP6-F: ATTTAGGTGACACTATAGAAGCGTTTCTAGCCATTTCCTATCGT, and trpv4-T7-R: TAATACGACTCACTATAGGGAGACATTATCTGCTCCTAATCGAACC.All other primers can be found in Table S1. Digoxin labeled RNA probes of Sp6-sense and T7-antisense were synthesized using the DIG RNA Labeling Kit Sp6/T7 (Roche, Basel, Switzerland). ISH was conducted following the methodology outlined below. Briefly, the fixed gonads were processed by dehydration, paraffin embedding and serial sectioning (5 µm). Then the gonad slices were digested at 37 °C with 200 ng/mL proteinase K for 5 min. Hybridization was carried out for 16 h at 60 °C using a probe concentration of 1 ng/µL in the hybridization buffer. The samples were incubated with the Anti-Digoxigenin-AP conjugate (Roche, Basel, Switzerland) at a 1: 2500 dilution for 16h at 4 °C, and stained in NBT/BCIP staining solution (Roche, Basel, Switzerland) in the dark for 0.5–1.5h at room temperature. The results were observed and photographed using an optical microscope (Zeiss, Oberkochen, Germany). Drawings and final panels were designed using Adobe Photoshop CS6 (San Jose, CA, USA).ChIP experimentsChIP experiments were performed according to the Agilent Mammalian ChIP-on-chip manual. Briefly, gonadal tissues were processed into single cells and were fixed with 1% formaldehyde for 10 min at room temperature. The reactions were stopped by 0.125 M Glycine for 5 min with rotating. The fixed chromatin was sonicated to an average of (500-1000) bp (for ChIP qPCR) using the S2 Covaris Sonication System (USA) according to the manual. Then Triton X-100 was added to the sonicated chromatin solutions to a final concentration of 0.1%. After centrifugation, 50 µL of supernatants were saved as input. The remainder of the chromatin solution was incubated with Dynabeads previously coupled with 5 µg ChIP grade pStat3 antibodies overnight at 4 °C with rotation. The next day, after 7 times washing with the wash buffer, the complexes were reverse cross-linked overnight at 65 °C. DNAs were extracted by hydroxybenzene-chloroform-isoamyl alcohol and purified by a Phase Lock Gel (Tiangen, China). The ChIPed DNAs were dissolved in 100 µL distilled water. qPCR was performed using a Bio-Rad instrument. The enrichment was calculated relative to the amount of input as described. All experiments were repeated at least two times. The relative gene expression levels were calculated based on the 2−ΔΔCt method. The paired t-test was used for the statistical analysis. Data were shown as means± SD.Luciferase AssayHEK293T cells were seeded in 24-well plates in DMEM medium containing 10% FBS for 24h. The cells were then transiently transfected with the pGL4-kdm6b-luc or pGL4-kdm6bM-luc reporters using Lipofectamine 2000 (Invitrogen). pTKRenilla was used as an internal control. The luciferase activity was measured with the Dual-luciferase Reporter Assay system (Promega).Hematoxylin and eosin (H&E) experimentsH&E experiments were used for the identification of gonadal types in ricefield eels. The gonads were fixed in Bouin’s solution for at least 24 h, and the H&E experiments were performed by Wuhan Icongene Biotechnology Company. Briefly, dehydration and paraffin imbedding were then performed on the ASP6025S Automatic Vacuum Tissue Processor (Leica, Wetzlar, Germany). The samples were sectioned using the Leica microtome (Leica) at a thickness of 5 µm. After de-paraffinization, hydration and staining, the sections were examined on the Nikon ECLIPSE Ni-U microscope and micrographs were taken with the Digit Sight DS-Fi2 digital camera (Nikon).Gonadal sex identificationThe gonadal types were initially identified according to morphological features including the size, shape and color. The gonadal sex of each fish was confirmed by histological sectioning and microscopic observation. In some cases, gene expression analysis was also used to confirm the gonadal sex types. Male genes such as dmrt1 were not expressed in ovaries, slightly up-regulated in early ovotestes, and abundantly expressed in middle– and late-ovotestes.Long term temperature experimentsThe aim of this experiment was to assess the gonadal phenotypes of female fish that were reared at 25 °C (cool temperature, CT) vs 33/34 °C (warm temperatures, WT) over 6 months. The experiments were performed from September-3, 2024. 1.5-year-old wild female fish were transiently maintained for 3-5 day at the laboratory, and unhealthy animals were discarded. A total of approximately 400 female fish were randomly divided into the CT and WT groups, stocked in 10-12 tanks, at a density of 15-20 fish per tank. Fish were fed with commercial diet.1, 3, 6 months later, one tank in each group was randomly selected, and fish were anaesthetized and measured for body length and weight. The gonads were isolated and subjected to the histological analysis to determine the gonadal sex types. In some cases, gene expression analysis was used to determine the gonadal sex.Short term temperature experiments Animal experimentsThe experiments were used to explore how warm temperature treatment affects the expression of sex differentiation genes in ovaries in a short period of time (3-10 days). The ricefield eels were reared at 25 °C (cool temperature) and at 34 °C (warm temperature). The temperature-increase protocol started at 25 °C, with a progressive increase of 3 °C per day until reaching 34 °C. Temperature was monitored twice a day throughout the experiment. Fish were fed with Artemia daily.The ricefield eels from the Baishazhou market were transiently raised for 1-2 day at cool temperature (25 °C). The fish were then divided into 4 groups based on the temperature and the injected small molecules: 25 °C+ DMSO; 25 °C+ GSK1016790A; 34 °C+ DMSO; 34 °C+ RN1734. For the 34 °C group setting, the temperature of water was gradually increased by 3 °C every day until reaching to 34 °C. Before increasing the temperatures, the small molecules of appropriate doses were injected into ovaries. The final concentrations used were at 0.02 mg/kg body weight for RN1734, 0.01 mg/kg body weight for HO-3867 or GSK1016790A or Colivelin, and a similar volume of 1‰ DMSO were injected and served as control.To determine the upstream and downstream relationships between Trpv4 and pStat3, rescue experiments were performed by injecting the small molecules into the ovaries. Six groups were set up based on the temperature and the injected small molecules: 25 °C+ DMSO; 25 °C+ GSK1016790A; 25 °C+ GSK1016790A+ HO3867; 34 °C+ DMSO; 34 °C+ RN1734; 34 °C+ RN1734+ Colivelin.To investigate the role of Kdm6b, 0.5 µM GSK-J4, an Kdm6b specific inhibitor, was injected into the ovaries or added into the cultured ovarian explants and/or cells.Ovarian explant or cell cultureThe ovaries were isolated from female ricefields and washed with cold 2% pen/strep PBS 3 times. The ovaries were cut into 2 mm3 pieces, and/or were digested by 0.25% TrypE for 30 min into single cells. For single cell culture, after filtration, ovarian cells were plated and cultured in 12 well plates.For pharmaceutical experiments for Trpv4, the cells were divided into 4 groups: 26 °C+ DMSO; 26 °C+ GSK1016790A; 33 °C+ DMSO; 33 °C+ RN1734. For the 33 °C group setting, after 1-2 day of acclimation at 25 °C, the temperature of water was gradually increased by 3 °C every day until reaching to 33 °C. The doses of small molecules were optimized, and the final concentrations used were at 10 μM for RN1734, 100 nM for GSK1016790A and a similar volume of 1‰ DMSO were added and served as control. For pharmaceutical experiments for pStat3 function, 2 μM HO3867 and 20 μM Colivelin were added.To determine the upstream and downstream relationships between Trpv4 and pStat3, rescue experiments were performed. Six groups were set up based on the temperature and the small molecules: 25 °C+ DMSO; 25 °C+ GSK1016790A; 25 °C+ GSK1016790A+ HO3867; 33 °C+ DMSO; 33 °C+ RN1734; 33 °C+ RN1734+ Colivelin.Statistic analysisFor gene expression analyses, differences in mean values between two groups were assessed using Student’s t-test. A one-way ANOVA was used to compare the expression levels of each target and the differences were determined using Tukey’s post hoc test. Significance was defined as *p <0.05, **p <0.01, ***p <0.001, ****p <0.0001. Data are presented as mean standard error (SEM). Statistical analyses were conducted and graphs.Supplementary Figure legendsSupplementary Figure 1.Related to Figure 1.(A) The graph showing the annual temperature dynamic by month for 30 years in Wuhan area, Hubei province, China. The highest and lowest temperatures per month were shown. (B) Schematic of the whole process of sex change, summarizing morphology, length and gonadal histology across time (10 years). The ricefield eel are born as females. After 2 year growth, they reach sexual maturity. After spawning (ranging from May to August each year), females will enter 1-2 years of intersex stage before becoming functional males. The average lifespan of wild ricefield eel is around 10 years. (C) H&E staining images showing the typical cell types in an ovary of a 2-year-old female, before spawning. Bar: 200 µm. (D) The average body length of fish that were raised for 90 and 180 days at the indicated temperatures. (E) The average body weight of fish that were raised for 90 and 180 days at the indicated temperatures. ns: not significant. The experiments were repeated two times.Supplementary Figure 2.Related to Figure 2.(A) The qPCR results showing the expression patterns of the indicated female sex genes in repeated temperature shifting experiments of in vitro cultured ovaries. n=5 per group. (B) The qPCR results showing the expression of trpv4 at the indicated time points of in vitro cultured ovarian explants. n=5 per group. (C) The qPCR results showing the expression of the indicated temperature responding– and sex-biased genes in ovaries of females that reared at 25 °C and after 1 day exposure to 34 °C. n=5 per group. *: P< 0.05, **: P< 0.01, ***: P< 0.001, and ****: P< 0.0001. ns: not significant. All experiments were repeated at least three times.Supplementary Figure 3.Related to Figure 3.(A) qPCR results showing the expression of the indicated male– and female-biased genes in ovarian explants cultured at 25 °C and 34 °C with increasing doses of small molecule RN1734. n=5 per group. (B) qPCR results showing the expression of the sex-biased genes at the indicated conditions, based on in vitro cultured ovarian explants. n=5 per group. (C) WB images showing the expression levels of the indicated proteins at the indicated conditions, based on in vitro cultured ovarian explants. (D) Quantification of panel C. (E) IF images showing the expression levels of Dmrt1 at the indicated conditions, based on in vitro cultured ovarian explants. n=5 per group. (F) Quantification of panel C. *: P< 0.05, **: P< 0.01, ***: P< 0.001, and ****: P< 0.0001. All experiments were repeated at least three times.Supplementary Figure 4.Related to Figure 5.(A-B) The representative IF images showing the expression of pERK and Amh from ovaries, ovotestes, and testes. n=6 per group. The experiments were repeated at least two times.Supplementary Figure 5.Related to Figure 6.(A) qPCR results showing the expression of the indicated genes at the indicated conditions, based on in vitro cultured ovarian explants. (B) Representative IF images showing the expression of pStat3 at the indicated conditions, based on in vitro cultured ovarian explants. n=6 per group. (C) qPCR results showing the expression of the indicated genes at the indicated conditions, based on in vitro cultured ovarian explants. *: P< 0.05, **: P< 0.01, ***: P< 0.001, and ****: P< 0.0001. ns: not significant. All experiments were repeated at least three times.AcknowledgementsThis work was supported by the National Key Research and Development Program of China (2022YFD2400101) to YH Sun. We thank Tanhong Eel Industry Aquaculture Co., Ltd (Chibi city, Hubei Province) for collecting the fish materials and fish framing. We are grateful to Prof. Jianzhen Li from Northwest Normal University for critical comments for this work.Additional informationData availabilityAll data are available upon reasonable requestAuthor contributionsZ Yang, TT Luo and YM Zhang performed experiments and generated data; YH Sun planned and designed experiments; YH Sun wrote the manuscript; all authors edited the manuscript.FundingMOST | National Key Research and Development Program of China (NKPs)Yuhua SunAdditional filesSupplementary file 1. Uncropped western blot figures.Table S1.Table S2.References1.Castelli M.A.Whiteley S.L.Georges A.Holleley C.E2020Cellular calcium and redox regulation: the mediator of vertebrate environmental sex determination?Biol. Rev. Camb. Phil. Soc 95:680–695https://doi.org/10.1111/brv.12582Google Scholar2.Chan S.HPhillips J.G1967Structure of gonad during natural sex reversal in Monopterus albus (Pisces: Teleostei)Journal of Zoology 151:129–141Google Scholar3.Chen Q.Yang D.Chen M.Xiong J.Huang J.Ding W.Gao K.Lai B.Zheng L.Tang Z.Zhang M.Yan T.He Z2024Smad4 and FoxH1 potentially interact to regulate cyp19a1a promoter in the ovary of ricefield eel (Monopterus albus)Biol. SexDiffer 15:60–71Google Scholar4.Cheng H.Zhou R2022Decoding genome recombination and sex reversalTrends Endocrinol. Metabol 33:175–185Google Scholar5.Deveson I.W.Holleley C.E.Blackburn J.Marshall Graves J.A.Mattick J.S.Waters P.D.Georges A2017Differential intron retention in Jumonji chromatin modifier genes is implicated in reptile temperature-dependent sex determinationSci. Adv 3:e1700731Google Scholar6.Dupont S.Garcia-Moreno A.O’Neil E VCapel B2025KDM6B is a conserved activator at the top of the male sex determination pathwayDevelopment 152:dev204724Google Scholar7.Fan M.Yang W.Zhang W.Zhang L2022The ontogenic gonadal transcriptomes provide insights into sex change in the ricefield eel Monopterus albusBMC Zool 7:56–71Google Scholar8.Fan M.Yang W.Sun S.Li Z.Zhang L.H.Zhang W2021Natural sex change of the “virgin” female ricefield eel Monopterus albusActa Hydrobiologica Sinica 45:387–396https://doi.org/10.7541/2021.2020.142Google Scholar9.Ge C.T.Ye J.Weber C.Sun W.Zhang H.Y.Zhou Y.J.Cai C.Qian G.Y.Capel B2018The histone demethylase KDM6B regulates temperature-dependent sex determination in a turtle speciesScience 360:645–650Google Scholar10.Güler A.D.Lee H.Iida T.Shimizu I.Tominaga M.Caterina M2002Heat-evoked activation of the ion channel TRPV4J Neurosci 22:6408–6414Google Scholar11.Haltenhof T.De Bortoli F.Schiefer S.Meinke S.Emmeriches A.K.Petermann K.Timmermann B.Imhof P.Franz A.Loll B.Wahl M.C.Preushner M.Heyd F.2020A conserved kinase-based body-temperature sensor globally controls alternative splicing and gene expressionMolecular Cell 78:57–69Google Scholar12.He Y.Shang X.Sun J.Zhang L.Zhao W.Tian Y.Cheng H.Zhou R2010Gonadal apoptosis during sex reversal of the rice field eel: implications for an evolutionarily conserved role of the molecular chaperone heat shock protein 10J. Exp. Zool. B Mol. Dev. Evol 314:257–266https://doi.org/10.1002/jez.b.21333Google Scholar13.He Z.Deng F.Yang D.He Z.Hu J.Ma Z.Zhang Q.He J.Ye L.Chen H.He L.Luo J.Xiong S.Luo W.Yang S.Gu X.Yan T2022aCrosstalk between sexrelated genes and apoptosis signaling reveals molecular insights into sex change in a protogynous hermaphroditic teleost fish, ricefield eel Monopterus albusAquaculture 552:737918–737931https://doi.org/10.1016/j.aquaculture.2022.737918Google Scholar14.He Z.Ye L.Yang D.Ma Z.Deng F.He Z.Hu J.Chen H.Zheng L.Pu Y.Jiao Y.Chen Q.Gao K.Xiong J.Lai B.Gu X.Huang X.Yang S.Zhang M.Yan T2022bIdentification, characterization and functional analysis of gonadal long noncoding RNAs in a protogynous hermaphroditic teleost fish, the ricefield eel (Monopterus albus)BMC Genom 23:450–467Google Scholar15.He Z.Xiao F.Yang D.Deng F.Ding W.He Z.Wang S.Chen Q.Wang H.Chen M.Gao K.Xiong J.Tang Z.Zhang M.Yan T2024Protein expression patterns and metal metabolites in a protogynous hermaphrodite fish, the ricefield eel (Monopterus albus)BMC Genom 25:500–515Google Scholar16.Holleley C.E.O’Meally D.Sarre S.D.Graves J.M.Ezaz T.Matsubara K.Azad B.Zhang X.W.Georges A.2015Sex reversal triggers the rapid transition from genetic to temperature dependent sexNature 523:79–83Google Scholar17.Hu Q.M.Lian Z.T.Xia X.P.Tian H.F.Li Z2022Integrated chromatin accessibility and DNA methylation analysis to reveal the critical epigenetic modification and regulatory mechanism in gonadal differentiation of Monopterus albusBiology of Sex Differences 13:73–88Google Scholar18.Huang J.W.Wang X.Y.Gao X.Y.Liu Q.H.Li J2024Transient receptor potential (TRP) channels in Sebastes schlegelii: Genome-wide identification and ThermoTRP expression analysis under high-temperatureGene 910:148317Google Scholar19.Huang X.Guo Y.Q.Shui Y.Gao S.Yu H.S.Cheng H.H.Zhou R.J2005Multiple alternative splicing and differential expression of dmrt1 during gonad transformation of the ricefield eelBiology of reproduction 73:1017–1024Google Scholar20.Ji F.Y.Yu Q.X.Liu J.D2001Micro-isolation of individual chromosome for gene localization in ricefield eelChinese Science Bulletin 22:1894https://doi.org/10.3321/j.issn:0023-074X.2001.22.012Google Scholar21.Jiang Y.J.Luo H.R.Hou M.X.Chen J.Tao B.B.Zhu Z.Y.Song Y.L.Hu W2022Aromatase inhibitor induces sex reversal in the protogynous hermaphroditic rice field eel (Monopterus albus)Aquaculture 551:737960–737972Google Scholar22.Kumar A.2015Regulation of TRP channels by steroids: Implications in physiology and diseasesGeneral and comparative endocrinology 220:23–32Google Scholar23.Li J.M.Ye Y.Z.Zheng D.Pei Z.D.Du W.G.Yang S.L2025Molecular basis for thermal switch of temperature-dependent sex determination in a turtle speciesScience Bulletin 70:3319–3323Google Scholar24.Liem K.F1963Sex reversal as a natural process in the synbranchiform fish Monopterus albusCopeia 2:303–312Google Scholar25.Lin J.Q.Zhou Q.Yang H.Q.Fang L.M.Tang K.Y.Sun L.Wan Q.H.Fang S.G2018Molecular mechanism of temperature-dependent sex determination and differentiation in Chinese alligator revealed by developmental transcriptome profilingSci. Bull 63:209–212https://doi.org/10.1016/j.scib.2018.01.004Google Scholar26.Lin Q.H.Mei J.Li Z.Zhang H.M.Zhou L.Gui J.F2017Distinct and cooperative roles of amh and dmrt1 in self-renewal and differentiation of male germ cells in zebrafishGenetics 207:1007–1022Google Scholar27.Liu C.K.1944Rudimentary hermaphroditism in the symbranchoid eel Monopterus javanensisSinensia :1–8Google Scholar28.Liu J.K.Gu G.Y.1950Morphological changes in the gonad of Monopterus during sex reversalScience 2:91Google Scholar29.Liu LGuo MLv XWang ZYang JLi YYu FWen XFeng LZhou T2021Role of Transient Receptor Potential Vanilloid 4 in Vascular FunctionFront. Mol. Biosci 8:677661https://doi.org/10.3389/fmolb.2021.67766Google Scholar30.Liu X.Y.Wang L.C1987The relationship between sex and age, body length, and weightFreshwater fisheries 6:12–15Google Scholar31.Lu J.Huang S.Wei S.Cheng J.Li W.Fei Y.et al.2025Heat inducible nuclear translocation of Kdm6bb drives temperature dependent sex reversal in Nile tilapiaPLoS Genet 21:e1011664https://doi.org/10.1371/journal.pgen.1011664Google Scholar32.Luo T.TZeng G.X.Xia C.C.Hu Z.X.Xue L.Z.Sun Y.H.2026Surrogate production of ricefield eel sperm by germ cell transplantation in adult zig-zag eelWater Biology and Security Google Scholar33.Luo ZYet al.2023TRPV4 activation mediates Ca2+ influx and facilitates infectious spleen and kidney necrosis virus (ISKNV) replicationJournal of Virology 97:1–14Google Scholar34.Martínez-Pacheco M.Díaz-Barba K.Perez-Molina R.Marmolejo-Valencia A.CollazoSaldana P.Escobar-Rodríguez M.Sanchez-Perez M.Meneses-Acosta A.MartínezRizo A.Sanchez-Pacheco A.U.Furlan-Magaril M.Merchant-Larios H.Cortez D2024Gene expression dynamics during temperature-dependent sex determination in a sea turtleDev. Biol 514:99–108Google Scholar35.Mei J.Gui J.F2015Genetic basis and biotechnological manipulation of sexual dimorphism and sex determination in fishScience China Life Sciences 58:124–136Google Scholar36.Mo X.Y.Pang P.Y.Wang Y.L.Jiang D.X.Zhang M.Y.Li Y.Wang P.Y.Geng Q.Z.Xie C.Du H.N.Zhong B.Li D.D.Yao J.2022Tyrosine phosphorylation tunes chemical and thermal sensitivity of TRPV2 ion channeleLife 11:e78301https://doi.org/10.7554/eLife.78301Google Scholar37.Mundt N.Spehr M.Lishko P.V2018TRPV4 is the temperature-sensitive ion channel of human spermeLife 7:e35853https://doi.org/10.7554/eLife.35853Google Scholar38.Shao C.W.et al.2014Epigenetic modification and inheritance in sexual reversal of fishGenome Research 24:604–615Google Scholar39.Shi J.Sheng D.L.Guo J.Zhou F.Y.Wu S.F.Tang H.Y2024Identification of BiP as a temperature sensor mediating temperature-induced germline sex reversal in C. elegansThe EMBO Journal 43:4020–4048Google Scholar40.Song Y.L.Luo H.R.Tao B.B.Chen J.Luo D.J.Chen K.X.Zhou W.Z.Hu W2022Research Progress on the genetic basis of natural sex reversal and varieties breeding in Monopterus albusActa Hydrobiologica Sinica 46:1205–1214https://doi.org/10.7541/2022.2020.238Google Scholar41.Steinberg X.Lespay-Rebolledo C.Brauchi S2014A structural view of ligand dependent activation in thermoTRP channelsFront. Physiol 5:171–185Google Scholar42.Tao Y. X.Lin H. R.Van der kraak G.Peter R.E.1993Hormonal induction of precocious sex reversal in the ricefield eel, Monopterus albusAquaculture 118:131–140Google Scholar43.Tian H.F.Hu Q.M.Li Z.2021A high-quality de novo genome assembly of one swamp eel (Monopterus albus) strain with PacBio and Hi-C sequencing dataG3-Genes Genomes Genetics 11:jkaa032Google Scholar44.Todd E.V.Ortega-Recalde O.Liu H.Lamm M.S.Rutherford K.M.Cross H.Black M.A.Kardailsky O.Graves M.Hore T.A.Godwin J.R.Gemmell N.J2019Stress, novel sex genes, and epigenetic reprogramming orchestrate socially controlled sex changeScience Advances 5:eaaw7006Google Scholar45.Vrenken K.S.Jalink K.van Leeuwen F.N.Middelbeek J.2016Beyond ionconduction: channel-dependent and –independent roles of TRP channels during development and tissue homeostasis. Biochim. Biophys. Acta, MolCell Res 1863:1436–1446Google Scholar46.Wang X.Lai F.L.Xiong J.Zhu W.Yuan B.F.Cheng H.H.Zhou R.J2020DNA methylation modification is associated with gonadal differentiation in Monopterus AlbusCell Biosci 10:129https://doi.org/10.1186/s13578-020-00490-4Google Scholar47.Wang X.Lai F.L.Shang D.T.Cheng Y.B.Lan T.Cheng H.H.Zhou R.J2021Cellular fate of intersex differentiationCell Death and Disease 12:388–402Google Scholar48.Wang W.B.Zeng B.P.Luo Y.S.Han Q.Liu L.G2008The relationship between sex and body length and weight of ricefield eel in DongTing lake areaJournal of Hunan Agricultural University (Natural Sciences) 34:469–473Google Scholar49.Wang and Zeng2006Report on Monopterus albus from Hainan Infected with Pallisentis (Neosentis) celatus and Eustrongylides SpeciesSichuan Journal of Zoology 125:13–20Google Scholar50.Weber C.Zhou Y.J.Lee J.G.Looger L.L.Qian G.Y.Ge C.T.Capel B2020Temperature-dependent sex determination is mediated by pSTAT3 repression of kdm6bScience 368:3030–306Google Scholar51.Whiteley S.L.Weisbecker V.Georges A.Gauthier A.R.Whitehead D.L.Holleley C.E2018Developmental asynchrony and antagonism of sex determination pathways in a lizard with temperature-induced sex reversalSci. Rep 8:14892Google Scholar52.Whiteley S.L.Holleley C.E.Wagner S.Blackburn J.Deveson I.W.Marshall Graves J.A.Georges A2021Two transcriptionally distinct pathways drive female development in a reptile with both genetic and temperature dependent sex determinationPLoS Genet 17:e1009465Google Scholar53.Whiteley S.L.Wagner S.Holleley C.E.Deveson I.W.Marshall Graves J.A.Georges A2022Truncated jarid2 and kdm6b transcripts are associated with temperature-induced sex reversal during development in a dragon lizardSci. Adv 8:eabk0275Google Scholar54.Wu P.F.Wang X.F.Ge C.T.Jin L.Ding Z.H.Liu F.Zhang J.Gao F.Du W.G2024pSTAT3 activation of Foxl2 initiates the female pathway underlying temperature-dependent sex determinationPNAS 121:e2401752121https://doi.org/10.1073/pnas.2401752121Google Scholar55.Xiong Y.Wang S.Gui J.F.Mei J2020Artificially induced sex-reversal leads to transition from genetic to temperature-dependent sex determination in fish speciesScience China Life Science 63:157–159Google Scholar56.Yao Z.L.Fang Q.F.Li J.Y.Zhou M.Du S.J.Chen H.J.Wang H.Jiang S.J.Wang X.Zhao Y.Ji X.S2023Alternative splicing of histone demethylase kdm6b mediates temperature-induced sex reversal in the Nile tilapiaCurrent Biology 33:5057–5070Google Scholar57.Yatsu R.Miyagawa S.Kohno S.Saito S.Lowers R.H.Ogino Y.Fukuta N.Katsu Y.Ohta Y.Tominaga M.Guillette L.J.Iguchi T2015TRPV4 associates environmental temperature and sex determination in the American alligatorSci. Rep 5:18581–18591Google Scholar58.Ye Y.Z.Li J.M.Li W.M.Fu X.N.Zhang J.J.Yang S.L.Du W.G2025Transcriptional control of male-specific pathway in temperature-dependent sex determinationScience Bulletin https://doi.org/10.1016/j.scib.2025.07.025Google Scholar59.Yamamotoet al.2024Trpv4-mediated apoptosis of Leydig cells induced by high temperature regulates sperm development and motility in zebrafishCommunications Biology 7:96https://doi.org/10.1038/s42003-023-05740-yGoogle Scholar60.Zhang Y.M.Luo T.T.Sun Y.H2025A temperature-induced sex reversal mechanism in ricefield eelsWater Biology and Security https://doi.org/10.1016/j.watbs.2025.100360Google Scholar61.Zhou L.Gui J.F2016Jian-Kang Liu: a pioneer of sex determination studies in vertebratesProtein Cell 7:1–3Google Scholar62.Honeycuttet al.2019Warmer waters masculinize wild populations of a fish with temperature-dependent sex determinationScientific Reports 9:6527https://doi.org/10.1038/s41598-019-42944-xGoogle Scholar63.Gutzke W.H.N.Crews D1988Embryonic temperature determines adult sexuality in a reptileNature 332:832–834Google ScholarArticle and author informationAuthor informationYang ZhiInstitute of Hydrobiology, Chinese Academy of Sciences, Wuhan, China, College of Advanced Agricultural Sciences, University of Chinese Academy of Sciences, Beijing, China, Hubei Hongshan Lab, Wuhan, ChinaLuo TingtingInstitute of Hydrobiology, Chinese Academy of Sciences, Wuhan, China, College of Advanced Agricultural Sciences, University of Chinese Academy of Sciences, Beijing, China, Hubei Hongshan Lab, Wuhan, ChinaZhang YiminInstitute of Hydrobiology, Chinese Academy of Sciences, Wuhan, China, College of Advanced Agricultural Sciences, University of Chinese Academy of Sciences, Beijing, China, Hubei Hongshan Lab, Wuhan, ChinaSun YuhuaInstitute of Hydrobiology, Chinese Academy of Sciences, Wuhan, China, College of Advanced Agricultural Sciences, University of Chinese Academy of Sciences, Beijing, China, Hubei Hongshan Lab, Wuhan, ChinaFor correspondence: sunyh@ihb.ac.cnAuthor NotesCompeting interests: No competing interests declaredVersion historySent for peer review: July 8, 2025Preprint posted: July 9, 2025Reviewed Preprint version 1: August 26, 2025Reviewed Preprint version 2: March 6, 2026Cite all versionsYou can cite all versions using the DOI https://doi.org/10.7554/eLife.108272. This DOI represents all versions, and will always resolve to the latest one.Copyright© 2025, Zhi et al.This article is distributed under the terms of the Creative Commons Attribution License, which permits unrestricted use and redistribution provided that the original author and source are credited.Metricsviews419downloads23citations0Views, downloads and citations are aggregated across all versions of this paper published by eLife.

来源:e life发布时间:2025-08-26
Faroese Whole Genomes Provide Insight into Ancestry and Recent Selection

AbstractThe Faroe Islands are home to descendants of a North Atlantic founder population with a unique history shaped by both migration and periods of relative isolation. Here, we investigate the genetic diversity, population structure, and demographic history of the islands by analyzing whole genome sequencing data from 40 participants in the Faroe Genome Project. This represents the first whole genome sequencing panel of this size from the Faroe Islands. We observed numerous putatively functional private alleles, including stop gain variants and high impact missense variants in the cohort. Faroese individuals had a higher proportion of their genomes contained in long runs of homozygosity than other European groups, including Finnish, suggesting a more recent or stronger bottleneck in the Faroese population. Signals of positive selection were identified at loci containing genes that play roles in vitamin D and dietary fat absorption and DNA repair, while increased diversity on lactase persistence haplotypes was observed. Fine-scale analysis of haplotype structure in present-day and ancient European genomes revealed genetic affinities with ancient Iron Age individuals from the North and West of Europe, providing evidence for potential contributions to the Faroese gene pool from Celtic and Viking populations as well as information about the temporal order in which these events happened. This study highlights the impact of evolutionary processes, such as ancient admixture, founder events, and positive selection, on the present-day genetic architecture of North Atlantic founder populations like the Faroe Islands.IntroductionThe Faroe Islands, nestled in the North Atlantic Ocean between Iceland and Norway, are home to the descendants of a North Atlantic founder population with a rich cultural heritage and a unique history shaped by both migration and periods of relative isolation. The exact settlement history of the islands is unclear, though historical records and analysis of Y-chromosome microsatellite markers point to a few founders most likely having arrived primarily from Scandinavia and the British Isles starting around the 9th century C.E.1–3 However, archeological evidence supports a possible earlier settlement of the island around the 4th-6th centuries C.E.4 Studies of mtDNA reveal an excess of maternal ancestry from the British Isles, while Y chromosome studies reveal an excess of paternal ancestry from Scandinavia, suggesting sex-biased admixture between these ancestral groups during the founding of the population.2,5 Since settlement and early waves of migration, the Faroe Islands have been mostly isolated and have experienced minimal immigration and population growth until recent years, with a census size of about 4,000 people in the 1700s6 increasing to over 54,000 as of August 2023 (https://hagstova.fo/en/population/population/population). Patterns of genetic diversity and linkage disequilibrium from a few genetic markers suggest a founder event, followed by a historically small population size and subsequent rapid expansion.7Overall, despite the small size and remote location of the Faroe Islands, the above evidence suggests that the genetic makeup of Faroese people may have been influenced by waves of early migration and admixture from various northwest European and Scandinavian populations. However, no population genomic studies have yet been carried out on whole–genome sequencing data to date, with the exception of one study investigating relatedness and autozygosity for a limited sample size of eight individuals.8 An in-depth analysis of the genomic architecture of the Faroese may reveal how the islands’ demographic history has contributed to present-day health and disease in this population. This is of particular interest as the Faroese have a high burden of certain diseases relative to global and other European populations, such as inflammatory bowel disease and type 2 diabetes, among others.9–18 The Faroe Genome (FarGen) Project set out to understand how the genetic diversity of the Faroese contributes to health.19Moreover, studying the genetic diversity of the Faroese provides potential insight into human migration, adaptation, and population structure in the North Atlantic region. Recently developed haplotype-based methods can provide fine resolution for inferring shared ancestry among individuals and the detection of population-specific haplotypes, but they require panels of whole-genome sequencing data.20 These methods serve to better account for recent patterns of population structure and cryptic relatedness in population-based genetic studies, particularly in populations like the Faroe Islands with strong founder effects.In this study, we present the first whole genomes sequenced as part of the FarGen Project. A set of 40 individuals were selected to optimally represent the genetic diversity of the broader Faroese population, with the aid of genealogical data reaching back to approximately 1650 CE. Whole genome sequencing (WGS) data was generated and used to identify putatively functional alleles enriched in the Faroese population, assess ancestry patterns within contemporary genomes, map signals of recent positive selection, and analyze local ancestry in a combined dataset of ancient and contemporary genomes of European descent spanning a period of 3,000 years.This study provides insight into the genetic variation, demographic history, and selection landscape of the Faroese population. These first whole genomes from FarGen may serve as a useful reference for studies on the broad implications of various evolutionary genetic processes, including bottlenecks, ancient admixture, and positive selection. More in-depth studies may expand this current study by further investigating the genetic architecture of the Faroese to unravel the demographic and evolutionary history of the population and its impact on complex traits and diseases in the islands.ResultsWhole Genome Sequencing of Faroese IndividualsThe Faroese Multi Generation Register (https://fargen.fo/research/multi-generation-registry) was used to reconstruct a single connected genealogical tree for the 1,541 participants in the first phase of the FarGen cohort.19,21 Individuals with fewer than six direct ancestors (two parents and four grandparents) recorded in the registry were excluded. Pairwise kinship coefficients were estimated from the genealogical tree and used to perform relatedness pruning with a threshold of 2−6 resulting in 332 minimally related individuals. We defined six geographical regions of the Faroe Islands using language dialects, and assigned individuals to these regions based on their place of birth (Fig. 1A). A total of 40 minimally related individuals were selected for inclusion in the study, with five to eight individuals sampled from each region.Figure 1.A Faroese whole genome reference.A) Map of the Faroe Islands, colored by the six sampling regions. The number of minimally related FarGen participants from each region selected for whole genome sequencing is indicated. B) Principal component analysis (PCA) of Faroese genomes jointly called with relevant 10000 Genomes reference data shows separation of European groups by PCs 3 and 4 (FARO, Faroese, CEU, Central Europeans, GBR, British, FIN, Finnish IBS, Iberian, TSI, Tuscan, CHB, Han Chinese, YRI, Yoruban). C) Faroese enriched putatively functional alleles visualized by minor allele count, CADD score, and Variant Effect Predictor (VEP) consequence. Variants shown are those with CADD > 30 and at least two minor alleles observed in Faroese individuals, and no minor alleles observed in Finnish or Northern European reference individuals. D) HLA-B allele frequencies for alleles detected at least twice in Faroese individuals. In this cohort, 1 minor allele corresponds to an allele frequency of 1.25%.The genomes of the 40 individuals were sequenced to a median depth of 20x in the Faroe Islands at the FarGen laboratory, and they all passed quality control metrics (Fig. S1, Table S1). Variant calling was performed jointly with relevant reference genome panels, including 1000 Genomes high-coverage data from Northern European (CEU & GBR, N = 190), Southern European (TSI & IBS, N = 214), Finnish (FIN, N = 99), East Asian (CHB, N = 103), and West African (YRI, N = 108) individuals, and imputation was performed within the cohort using an approach we have previously described.22,23 The first component of principal component analysis (PCA) on the jointly called genotype data captured the cline between West African (YOR) and all other individuals, and the second component captured the cline between East Asian (CHB) and all other individuals (Fig. S1). Principal components three and four separated European individuals, with Faroese individuals forming a distinct cluster from Finnish, Northern European, and Southern European reference groups (Fig. 1B).Variant calls were annotated with predicted functional impact and allele frequency across the reference groups. Using these annotations, we identified 35 putatively functional alleles present in our Faroese panel, that are unobserved in the European mainland reference panels included in this study (CADD > 30 and at least two minor alleles observed in Faroese individuals, and no minor alleles observed in Finnish or Northern European reference individuals, Table S2). These included 13 stop gain variants and 18 missense variants, and a maximum minor allele count of 5, corresponding to a frequency of 6.25% in the cohort (Fig. 1C).HLA-B Allele FrequenciesObservational evidence from the FarGen project recruitment data suggest that ankylosing spondylitis (AS) may be at a higher prevalence in the Faroe Islands ; however, more formal epidemiological studies are required to confirm this observation. The major histocompatibility complex (MHC) plays a role in various autoimmune diseases that may be at higher prevalence in the Faroes, including ankylosing spondylitis and other more common diseases like inflammatory bowel disease.24,25 In particular, HLA-B*27 is associated with ankylosing spondylitis (AS), with approximately 80-90% of AS patients carrying the HLA-B*27 allele.25 It explains about 30% of the heritability, and ∼6-8% of European populations are carriers of HLA-B*27.25–28 Using the WGS data, we genotyped human leukocyte antigen (HLA) alleles with HLA*LA.29 We provide HLA-B allele counts and allele frequencies in the Faroese cohort as well as the allele frequencies in 1000 Genomes British (GBR), Central European (CEU), and Finnish (FIN) individuals (Table S3). To the best of our knowledge, there have not been any larger studies of HLA-B allele frequencies in Faroese individuals, and none are currently recorded in the Allele Frequency Net Database.30The most frequent HLA-B allele in the Faroese cohort is HLA-B*07:02 (17.5% of haplotypes), which is a common haplotype in European populations (Fig. 1D).31,32 We did not observe a substantial difference in HLA-B*27 allele frequency in Faroese individuals (6.25% with four B*27:05 and one B*27:01 calls) as compared to other European reference groups (2-7.6%). While 80-90% of people of European ancestry with AS carry the HLA-B*27 allele, only ∼6% of HLA-B*27 carriers in the US and Europe have AS.33–35 The low frequency of the HLA-B*27 allele in this Faroese cohort in the population broadly suggests that if AS is at a higher prevalence, there may be other underlying genetic or environmental factors that explain some of the increased risk.Population Structure and RelatednessPairwise kinship was calculated in the cohort using popkin.36–38 Clustering by geography was observed when including global reference populations in the kinship calculation. The Faroe Islands have high pairwise kinship within the cohort when compared to other global populations, which may be indicative of recent bottlenecks (Fig. S2A). The Faroese individuals do not show obvious clustering by region, though this is expected given the relatedness pruning during sample selection (Fig. S2B).We also looked at runs of homozygosity (ROHs) in the Faroese and reference cohorts (Fig. 2), which can provide further insights into the demographic history of the population. As the Faroese population likely experienced a founder event during the settlement of the islands followed by rapid population size expansion in recent generations, we would expect to see more of the genome contained in ROHs compared to other global populations that have not experienced as strong a bottleneck.39 When looking at the sum total amount of the genome in ROHs, we found overall elevated levels of ROH in the European and Asian groups included in this analysis, most likely reflecting ancestral out-of-Africa bottlenecks for Eurasian populations (Fig. 2, top panel). However, the Faroese population did not have an elevated total amount of the genome contained in ROHs compared to other European groups.Figure 2.Runs of homozygosity by group.Amount of the genome (Mb) contained in runs of homozygosity (ROH) stratified by group. Top panel is the sum total of the genome contained within ROH, with the other panels showing this split by length (short, medium, and long).To explore this further, we calculated the sum total amounts of ROH at different size categories (small, medium, large) (Fig. 2, bottom 3 panels). We see that, on average, the Faroese individuals have less of the genome contained in short (<300 Mb) and medium ( > 300 Kb and <= 1 Mb) ROHs compared to other European groups, but more of the genome contained in long ( > 1Mb) ROHs. Short and medium ROH are chunks inherited from older ancestors and reflect older events, for example, an ancient population bottleneck or founder event that has resulted in lower overall haplotype diversity, yet with enough time for recombination to break up haplotypes, while long ROH reflects chunks inherited from recent ancestors and can reflect more recent bottleneck events.39 Interestingly, the average amount of an individual’s genome that is contained in ROHs extending over 1Mb in length is higher in the Faroese population (∼82.5 Mb) than the Finnish reference individuals (∼63.9 Mb) and any of the other groups analyzed. Additionally, distribution in ROH lengths across all individuals stratified by group shows that, on average, there is a higher proportion of long ROH particularly in the 5-15 Mb range in the Faroese cohort relative to the other cohorts (Fig. S3). This is consistent with a more recent or stronger bottleneck or founder event.Signals of Positive SelectionWe investigated signals of recent or ongoing positive selection in this Faroese cohort by calculating both the integrated haplotype score (iHS)40 and cross-population expected haplotype homozygosity (XPEHH) using hapbin.41 The sample size of the WGS cohort is relatively small (n=40), so our ability to detect signals of selection is limited. For comparison, we also calculated iHS in British individuals from the 1000 Genomes (GBR) that were included in joint calling and passed subject-level filters (n=90). The iHS values were standardized genome-wide and two-tailed p-values were computed according to the standard normal distribution. We additionally calculated q-values (the minimum False Discovery Rate (FDR) should a test be considered significant) for each test,42 and determined p-value significance thresholds at which FDR < 0.01 and FDR < 0.001 for each population (see Methods). We observed that a number of significant selection signals were shared between the Faroese and British cohorts, which is not unexpected given the relationship between these two populations (Fig. 3A-B). The strength of these signals did differ from one population to the other, though this may be due to differences in sample size or changes in selection pressure after the populations diverged. To better identify population-specific signals, we also calculated XPEHH comparing Faroese and British haplotypes, and identified significance cutoffs following the same approach described above (Fig. 3C).43 Any extreme positive values of this statistic indicate longer haplotypes at a focal marker in the Faroese cohort compared to the British cohort, while extreme negative values indicate the reverse. Therefore, positive values are indicative of selection signals in the Faroese cohort. Across both tests, we highlight 20 loci with the most extreme values for these statistics, serving as evidence of positive selection in the Faroese genomes at those loci (Table S4).Figure 3.Selection scan results for Faroese and British cohorts.A) Log transformed two-tailed p-value of the standardized integrated haplotype score (iHS) in the 40 Faroese genomes (FARO). B) Log transformed two-tailed p-value of the standardized iHS for 90 British WGS samples from 1000 Genomes (GBR). C) log transformed two-tailed p-value for the standardized cross-population expected haplotype homozygosity (XPEHH) for FARO vs GBR (only positive values, which indicate selection in FARO, are plotted). Some genes in the top loci are indicated on each plot. The p-value cutoffs which correspond to a False Discovery Rate (FDR) at 0.01 and 0.001 are respectively indicated by the red dotted line and blue dashed line in each plot. A) For iHS in FARO, these cutoffs are p = 2.72 x 10⁻⁶ (FDR = 0.01) and p = 9.20 x 10⁻⁸ (FDR = 0.001). B) For iHS in GBR, the cutoffs are p = 2.78 x 10⁻⁶ (FDR = 0.01) and p = 1.75 x 10⁻⁷ (FDR = 0.001). C) For XPEHH in FARO vs GBR, the cutoffs are p = 2.35 x 10⁻⁶ (FDR = 0.01) and p = 3.01 x 10⁻⁸ (FDR = 0.001). See Methods for details on p-value and FDR estimation.One signal that has been consistently observed across northern European populations is in the LCT/MCM6 region, corresponding to positive selection for lactase persistence alleles.40,43–45 Interestingly, this region showed strong iHS signals (|standardized iHS| > 8) in GBR and was considered genome-wide significant in our analysis (minimum p = 5.95 x 10⁻¹⁹, q = 7.82 x 10⁻¹⁴) (Fig. 3B), but the signal is weaker in the Faroese (|standardized iHS| > 4) and was not considered significant in our analysis (minimum p = 3.57 x 10⁻⁶, q = 0.0118) (Fig. 3A). To investigate the haplotype structure further, we plotted the decay in expected haplotype homozygosity (EHH)46 and haplotype furcation around one of the lactase persistence alleles (rs4988235; chr2_135851076_G_A) for the Faroese and British cohorts using the rehh package (Fig. 4A-D).47 The decay and furcation plots are centered around the focal marker, and a furcation occurs when unique haplotypes arise at an allele, similar to a tree splitting into branches. Thicker branches in the furcation plot indicate higher frequency of that haplotype in the population. Significant differences between the furcation patterns for an “ancestral” (reference) and “derived” (alternate) allele correspond to extreme iHS values and therefore are indicative of strong positive selection. For an alternative view of the region, we used Haplostrips to visualize the haplotype structure from chr2:135677850-135986443 (Fig. 4E).48 From these plots, we observed far less diversity on the lactase persistence haplotype in GBR, consistent with a stronger selection signal. This may be explained by shared selection on the ancestral northern European branch followed by either relaxed selection for lactase persistence or population-specific drift in the Faroes after the population split from other northern European groups and settled the archipelago.Figure 4.Haplotype visualizations for the LCT/MCM6 locus.A) Decay in Expected Haplotype Homozygosity (EHH) and B) haplotype furcation plot for FARO centered on lactase persistence allele rs4988235; chr2_135851076_G_A. C) Decay in EHH for GBR and D) haplotype furcation for GBR centered on the same allele. E) Haplostrips visualization of haplotype structure in the region chr2:135677850-135986443. In this panel, columns correspond to segregating alleles, and rows correspond to individuals. In the haplotype furcation plots (panels B & D), the haplotypes for the reference allele (G) are in blue, and those for the alternate allele (A) are in red.One of the top XPEHH signals in the Faroese WGS cohort included variants in SLC10A1 (Fig. S4), a sodium/bile acid transporter that plays a role in circulating bile salts to and from the liver and small intestine for the absorption of dietary fat and fat-soluble vitamins such as vitamin D.49–52 SLC10A1 deficiency has been associated with familial hypercholanemia, or elevated concentrations of bile acids, which can lead to fat malabsorption and vitamin D deficiencies among other secondary health conditions.50,53,54 Another top XPEHH signal included variants in POLQ, encoding for a DNA polymerase which plays a role in DNA repair (Fig. S5).55–59 POLQ has been shown to be involved in various cancers in mice and humans, in particular skin, stomach, lung, breast, and colon cancers.55,59–62Fine-Scale Structure and Connections to Ancient GenomesGiven that early Faroese settlers have documented historical relations to both Northern European Vikings and Northwestern European Celtic communities, we sought to study fine-scale genome-wide ancestry relationships between the sequenced Faroese genomes and publicly available ancient genomes from Iron Age and Viking Age Europe. We downloaded 616 ancient imputed genomes from Allentoft et al. 2024, spanning from the present-day to the late Bronze Age from Europe and focusing specifically on West- and North-Europe, including ancient Faroese genomes.63 We incorporated these genomes into a combined panel including our present-day Faroese dataset and used the software HaploNet to infer fine-scale population structure based on patterns of haplotype similarity across the genome.20HaploNet identified five ancient sources, through unsupervised ancestry estimation. We then used HaploNet to model both ancient and present-day Faroese genomes as composites of any of the five ancestries through supervised ancestry estimation. We used the ancestral haplotype cluster frequency estimates from individuals not found in the Faroe Islands in order to estimate the admixture proportions of these sources in the European mainland. We used these admixture proportions to label the sources based on the locations in the map where these ancestries tend to be maximized in the Iron Age and Viking Age periods. The resulting labels were: “Steppe”, “East Europe”, “Levant and East Mediterranean”, “West Europe” and “North Europe”. For example, the ancestry labeled “West Europe” is maximized in individuals predominantly found in Celtic contexts (e.g. Roman and Iron Age Britain, Iron Age France) while the ancestry “North Europe” is maximized in individuals characteristic of historically Viking or pre-Viking contexts (e.g. Iron Age individuals from Denmark, as well as Viking Age individuals from Denmark, Norway, Sweden, and Estonia). However, we note there is no one-to-one correspondence between archaeological context and genetically inferred ancestry, and that many mainland individuals contain inferred ancestries from diverse sources. Indeed, Margaryan et al. 2020 showed that Viking-context individuals can derive ancestries from multiple Bronze and Iron Age sources across Europe.64We then focused on the frequency of the ancestry sources in the Faroese individuals. We find that the present-day Faroese individuals are predominantly composed of roughly equal proportions of “West” and “North Europe” ancestry, while “East” and “South Europe” ancestries are detected at much lower frequencies (40% North Europe, 33.1% West Europe, 12.2% Levant, 8.5% East Europe, 6.2% Steppe). Present-day ancestry proportions are nearly identical to those found in the Faroese ancient samples from the Sandur church site in Sandoy and dated to the 17th or 18th centuries based on their archaeological contexts (37.3% North Europe, 35.6% West Europe, 12.0% Levant, 8.1% East Europe, 7.0% Steppe) (Fig. S6).64 Margaryan et al. also sequenced a Faroese sample that was excavated from the á Bønhúsfløtu site in the village of Hvalbøur on Suðuroy, and was contextually-dated to be approximately 800 years old. This individual is inferred to be almost entirely composed of “West Europe” ancestry (Fig. S7).We utilized haplotype cluster likelihoods to explore population structure in the same set of samples. When plotting ancient European samples together with the Faroese samples (Fig. 5), we observe that present-day Faroese individuals (circled in black) separate from the ancient Europeans along the second principal component (PC2), as do the older Faroese samples from the 17th and 18th centuries (circled in red). This perhaps suggests a bottleneck process that differentiates the 17th/18th-century and present-day Faroese from the rest of the ancient European samples, in concordance with the above ROH results. Notably, the 800-year-old sample of a Faroese individual with predominantly “West Europe” ancestry does not fall along the Faroese PC2 cline, suggesting that this individual might predate the bottleneck.Figure 5.PCA analysis of 616 ancient imputed genomes from Europe and 40 present-day Faroese genomes.Each individual is depicted as a pie chart, showing ancestry proportions estimated using Haplonet. Ancestry proportions for ancient individuals were estimated unsupervised, while those for present-day Faroese individuals were estimated semi-supervised using ancient genomes as references. The five colors represent different ancestral sources: orange for West Europe, green for North Europe, blue for Steppe, purple for the Levant and East Mediterranean, and red for East Europe. The geographical distribution (bottom-right) highlights historical samples (250 years BP) in red, this study’s samples in black, and an 800-year-old individual sample in blue.We estimated admixture timing for modern (n = 40) and ancient (n = 11) Faroese individuals using DATES with North and West Europe proxy references.65 The ancient Faroese had an average admixture estimate of 94.665 ± 58.658 generations prior to the dated age of the samples (∼980 BCE; 2,681 BCE - 720 CE, assuming 29-year generations) (Fig. S8A), while present-day Faroese showed more recent admixture at 72.567 ± 15.290 generations in the past (∼137 BCE; 581 BCE - 306 CE) (Fig. S8B). The high standard errors and inconsistency between estimates may reflect confounding due to drift and bottlenecks in the target population (as noted by Narasimhan, Patterson et al.)65 or low differentiation in linkage patterns between the source populations. Additionally, DATES assumes a single admixture pulse, but additional waves, particularly in the present-day Faroese, could shift estimates toward the present. In both cases, estimated admixture timing predates Faroese settlement, which likely began in the 9th century CE,1–3 but possibly as early as the 4th-6th centuries CE.4DiscussionHere we have presented the first whole-genome sequence data from 40 minimally related individuals from across the Faroe Islands, a North Atlantic founder population. The Faroese have a high prevalence of several diseases in comparison to other European or global populations, several of which have been of particular interest in epidemiological studies of the region (e.g. inflammatory bowel disease, type 2 diabetes, multiple sclerosis).9–18 Additionally, observational evidence from the FarGen project recruitment data suggest a higher prevalence of ankylosing spondylitis, although follow-up epidemiological studies are required. We investigated the frequency of HLA-B27 in the Faroe Islands, an allele which has been previously associated with ankylosing spondylitis (AS). We found that despite the observed high prevalence of AS in the Faroe Islands there was no evidence of increased HLA-B27 allele frequency compared to other European populations. However, a stop gain variant in SERPINB10 was among those enriched in the Faroese cohort, and it may contribute to increased AS risk (rs138084090, AF = 2.5%). Rare variant analysis of this gene in the UK Biobank found that an independent stop gain variant in the same gene is nominally associated with increased AS risk (rs145346731, p = 2.5e-4), which was the most significant phenotypic association for the gene.66 SERPINB10 is most highly expressed in neutrophilic metamyelocytes,67 a cell type with disease relevance to AS.68 CCDC168, another gene with a Faroese enriched stop gain variant had highly significant rare variant associations in the UK Biobank with corneal hysteresis and intraocular pressure (rs1361247423, p = 1.79e-57, p = 5.21e-13, respectively). Finally, a Faroese enriched stop gain variant in AGL identified in this study (rs113994128) has been previously reported as causing glycogen storage disease type IIIA in the Faroe Islands, which is estimated to have the highest prevalence of the disease world-wide.69 These findings emphasize the importance of further research into the role that unique genetic variation in the Faroe Islands may play in the incidence of diseases that, while common in the Faroes, have a global burden as well.We found elevated amounts of the genome contained in long runs of homozygosity (ROHs) compared to other European reference cohorts, including another founder population from Finland. The higher proportion of the Faroese genome contained in these long ROHs suggests a stronger or more recent bottleneck in the Faroese population history. With the second phase of the FarGen study, a larger sample size will facilitate investigation into the timing and severity of the bottleneck(s). Additionally, founder populations such as the Finnish, have been a common focus for studies of founder events, genetic isolation, and the effects of haplotype sharing on aspects of human health and disease.70–73 As such, the Faroese population may serve as another useful global reference for studying the influence of demographic history on genetic variation and trait architecture. Long ROHs, in particular, can be enriched for deleterious variation or be of interest in understanding the genetic architecture of health-related traits in human populations.39,74 Studying these long ROHs may be relevant for future studies of health outcomes or other traits of interest in the Faroese population.We also detected several regions under recent positive selection in the population. It is likely that iHS measures selection older than the settlement of the Faroe Islands. Indeed, we found that many of the top selection signals were shared between the Faroese and British cohorts, which is unsurprising given the recent divergence between these two populations and likely reflecting selection that began prior to this divergence. We did find differences in the strength of these signals; for example, there is more diversity on the Faroese LCT/MCM6 lactase persistence haplotypes. The lactase persistence allele rs4988235 (chr2_135851076_G_A) has been inferred to be under strong selection at least until the medieval period in northwestern European groups.75,76 Patterson et al. 2021 found that the rate of increase in allele frequency may have slowed in recent periods; however, this does not exclude the possibility of continued or fluctuating selective pressure as this is consistent with the expected sigmoidal trajectory for an allele under ongoing selection.77 While the increased diversity on the Faroese lactase persistence haplotypes may be simply explained by population-specific drift, this result could also indicate relaxed selection for lactase persistence alleles after settlement of the Faroe Islands, possibly due to changes in dietary habits in the new environment. The traditional diet of the Faroe Islands consisted of a higher reliance on animal and marine fats such as sheep tallow, whale blubber, and liver from codfishes, while dairy products such as milk and cheese, and particularly that from cattle, were more limited in availability.78 The selected variant at rs4988235 is at 74% frequency in the modern Faroese cohort, and based on the ancient genomes for which we have available data, we can attest that the allele was present at in the Faroe Islands at high frequencies already in the 17th/18th centuries (∼82%), and imputation further suggests the haplotype containing the allele to at least have been present in the islands 800 years ago. We caveat that the sample size of the historical Faroese (11 individuals) is small and coverage of ancient samples is low, leading to potential errors in imputation. In the absence of selection or drift, we can calculate the expected frequency of an allele in an admixed population as the linear combination of allele frequencies and average ancestry contributions from the sources. Based on the frequency of the rs4988235 variant in proxy sources from the ancient panel, the expected allele frequency in the ancestral population at the time of admixture is approximately 47%. The difference in observed and expected allele frequencies may be due to drift, demography, changes in selection pressure, or a combination of these and other factors. We note limitations in this calculation as the proxy samples may not be good representatives for the true sources at the time of admixture, and there may have been multiple admixture events rather than a single pulse.We detected selection targets that were specific to the Faroese population using the XPEHH statistic with the British cohort as the comparison population. As XPEHH has the best power to identify alleles that are fixed or approaching fixation in one population but not others, it is unlikely to detect older selection events or incomplete sweeps from shared ancestral populations. One top selection signal is in POLQ, which plays a role in DNA repair and various cancers. Without collecting relevant phenotypes or environmental factors, it is difficult to hypothesize what selection pressure may be driving the strong signal in POLQ, so this will be an important area of follow-up for future studies. In another top signal, we find SLC10A1 which plays a role in fat and vitamin D absorption. Positive selection related to differences in dietary fat intake has been hypothesized in many human populations, such as the Inuit population in Greenland.79,80 Also situated in a far northern latitude, the Faroese diet is similar to that of the Inuit population, relying on animal and marine fats.78,81 The relationship between SLC10A1 and vitamin D levels may also be relevant, as the northern latitudes of the Faroe Islands and minimal UV exposure can lead to vitamin D deficiency, which has been hypothesized to be a strong selection pressure in populations in extreme latitudes.82,83Although we hypothesize that these results suggest possible adaptations to environmental pressures of diet or UV exposure in northern latitudes, we cannot draw definitive conclusions based on this current study. It is certainly possible that variants that have risen to high frequencies due to past or ongoing positive selection now play a role in health outcomes in modern populations. For example, the gene TBC1D4, which was shown to be under positive selection in the Greenlandic Inuit population likely due to a historical diet low in carbohydrates, has been associated with type 2 diabetes and insulin resistance in the same population.81,84 The prevalences of some diseases enriched in the Faroese population may be related to genomic regions under positive selection. For example, the results of several studies have suggested a role of vitamin D deficiency in the development of multiple sclerosis.85–87 Future studies could involve collection of relevant phenotypes and focus on characterizing selective pressures and fine-mapping targets of selection as have been done in studies that more thoroughly characterized selection signals related to dietary adaptation and UV exposure and their functional consequences in other northern latitude populations.80–82,84We have inferred ancestry tracts in the present day Faroese genomes that were inherited from ancient populations throughout Europe. We found that present-day Faroese individuals have similar relative ancestry contributions from past “North” and “West Europe” Iron Age populations. The most ancient genome available from the Faroe Islands matches ancestry patterns found in Iron Age West Europe. Admixture could have occurred either via a mixture of the original “West Europe” ancestry with individuals of predominantly “North Europe” ancestry, or a by replacement with individuals that were already of mixed ancestry at the time of arrival in the islands (the latter are not uncommon in Viking Age mainland Europe). Our analysis also suggests a bottleneck or a more progressive differentiation process in the islands relative to the mainland, which may postdate the most ancient Faroese genome currently available (approximately 800 years old). The most ancient Faroese sample from Margaryan et al. - composed almost entirely of “West Europe” ancestry - is a male individual found in a chapel-site in Suðuroy. Consistent with this, a local legend suggests this site may have been occupied by Irish monks.88 We note that it is difficult to draw conclusions based on a single individual. It is possible that this particular individual moved to the Faroe Islands within their lifetime. More ancient and present-day samples from the islands could shed further light on the history of the Faroese population.The average admixture timing between “North Europe” and “West Europe” sources (as estimated by DATES) pre-date the settlement of the Faroe Islands (137 BCE - 980 BCE). This is consistent with the low variance in ancestry proportion within the Faroese individuals (both historical and modern), indicating enough time for recombination to break up long ancestry tracts and for global ancestry proportions to reach an equilibrium in the population. That is, these ancestry patterns, combined with the DATES estimates, suggest that the present-day Faroese population is most likely descended from already admixed founders who arrived on the islands. Importantly, estimates of admixture timing had high statistical noise, possibly due to several confounding factors including drift, demography, and low differentiation between sources. In particular, it is unclear how the bottleneck history of the Faroese population may affect the performance of DATES. In future studies, it will be informative to estimate and simulate the bottleneck size in the Faroese population, and then test the performance of DATES on those simulations to confirm whether bottleneck history has affected the empirical estimates of admixture timing. Additionally, it will be important to model single-pulse versus multiple pulses of admixture to determine whether this has resulted in the different estimates for admixture timing in modern and ancient Faroese.This study focused on population genomic analyses such as selection scans, population structure, kinship, and ancestry. Given the unique settlement history and genetic architecture of the Faroe Islands, future studies which combine genomic data with relevant phenotype data could provide useful insight into the underlying genetic mechanisms of those traits. In particular, larger-scale genomic studies in the Faroese could investigate genetic risk factors which contribute to the high prevalence of autoimmune and metabolic disease on the islands. This is a focus of the second phase of the FarGen study, which is currently ongoing.MethodsSample Selection and Cryptic RelatednessFarGen cohortThe participants in this study voluntarily enrolled in the FarGen project (The Faroe Genome Project: https://www.fargen.fo/en/home/). The 1,541 subjects are extensively described in Apol et al. 2022.21 Participant inclusion criteria for the FarGen project are that participants must live in the Faroe Islands or be of Faroese descent. Apol et al. report that 96.4% of the participants have between one and four Faroese grandparents. The cohort has a mixed health status composition, with 75% of the participants self-reporting that they have a confirmed diagnosis. Apol et al. found that the cohort is somewhat biased in terms of geographical representation, with the capital region being substantially over-represented.Reconstruction of genealogyThe Multi-Generation Register at the Faroese Health Authority describes the ancestry of inhabitants of the Faroe Islands (http://fargen.fo/research/multi-generation-registry). The lineages can be traced back to approximately 1650 C.E. The register records birth date, parent identities, parents’ residence at the time of birth, and more. The Legacy Family Tree (https://legacyfamilytree.com) genealogy software is used to manage the digitized records. We reconstructed a genealogical tree of all the individuals in the FarGen cohort by looking up each individual, and recursively looking up their parents until there are no more ancestors. After reconstructing the genealogy of each individual two generations in the past, we discarded any who had fewer than 6 direct ancestors recorded in the Multi-Generation Registry (2 parents and 4 grandparents). We note that although an individual is recorded in the register, there is no guarantee they were born in the Faroe Islands.Geographical stratification through dialectWe defined six geographical regions of the Faroe Islands as annotated in Fig. 1A: Norðoyggjar; Eysturoy and Norðstreymoy; Suðurstreymoy; Vágar and Mykines; Sandoy, Skúvoy, and Stóra Dímun; Suðuroy, and placed individuals within these regions based on birth place. The boundaries of the regions were defined using isoglosses (i.e. boundaries where we see changes in dialect) as described in Þráinsson 2012.89 For example, the isogloss for "á", which may be pronounced either as [a:] or [ɔa], separates Norðoyggjar in the north from the rest of the islands.Calculating pairwise kinship coefficientsIn order to avoid sequencing highly related samples, we used the large constructed genealogy to account for cryptic relatedness. We calculated pairwise kinship coefficient between every individual using kinship2.90 This method assumes that the founders (individuals in the pedigree without recorded parents) are unrelated to other founders and each individual founder’s parents were not related to each other, which may not always be the case in this population.Sample selection using graph theoryWe constructed a relationship graph with nodes representing individuals, and connected two nodes by an edge if their kinship coefficient is above a given threshold as described below. Ideally, we would remove nodes such that all edges are removed, while keeping as many nodes as possible, referred to as the maximum independent set problem. Obtaining an exact solution to the maximum independent set is an NP-hard problem (exponential time complexity), making it infeasible for our applications. Instead, we obtained an approximate maximum independent set using an algorithm described in Boppana et al. 1990.91 We performed relatedness pruning with a threshold of 2−6 on 1,294 FarGen individuals who were not missing a birth region, resulting in 332 individuals. This was the minimum threshold for which we could have enough sampling from each region. From these 332 individuals, we sampled 5 to 8 from each region, yielding 40 individuals for whole genome sequencing and subsequent analyses.BioinformaticsSequencing and quality controlDNA samples from the 40 selected individuals were sequenced at FarGen (using TruSeq PCR-free libraries on Illumina NextSeq 500 instruments) to an average depth of 19.2x, ranging from 9.9x to 31.5x per sample. Sequencing QC was investigated with FASTQC, Picard (including CollectWgsMetrics for coverage) and VerifyBamID for contamination.Variant calling and imputationReads were processed with Variant Bio’s in-house processing pipeline based on the GATK Best Practices (CCDG functional equivalence version).92 Joint genotyping was performed with GATK (version 4.2.0.0) including 714 genomes from the 1000 Genomes Project (503 Europeans, 103 Han Chinese, 108 Yoruba) and followed by VQSR (--truth-sensitivity-filter-level to 99.8 for SNPs and 99.0 for indels). Only PASS variants in GIAB high-confidence regions (∼80% of GRCh38) were retained.93 Genotypes with GQ<=20 were filtered (set to missing) and imputation was performed within the full cohort of 754 genomes using Beagle v5.1. Variants enriched in the Faroese cohort and with predicted functional impact (Table S2) were additionally hard-filtered with VQSLOD>20.HLA typingWe ran HLA*LA (v1.0.3) on the mapped reads to determine HLA types for the 40 Faroese individuals as well as for the GBR, CEU, and FIN reference population individuals from 1000 Genomes.29 Benchmarking the method on 1000 Genomes Project data, where HLA types are known, we estimate overall HLA-B typing accuracy at 93.4%, 88.8% and 89.9% for the GBR (N=91), CEU (N=99), and FIN (N=99) reference populations. Accuracy of B27 detection specifically is 100% (N=10), 83.3% (N=6) and 100% (N=15) based on these three reference cohorts, respectively, with one B*27:05 allele mis-identified as B*27:26 in CEU. Table S3 contains counts, mean quality scores, and frequencies of all HLA-B alleles detected among the 40 Faroese as well as the GBR, CEU, and FIN reference populations.Population GeneticsIndividual and variant-level filteringBeginning with a total of 21,837,577 variants and 754 individuals, we applied various individual-level and variant-level quality control filters for downstream analyses. We filtered 8 individuals with mismatched sex based on genetics and reported information. We additionally filtered 5 individuals that were, for any of PCs 1-10, further than 7 standard deviations from the mean. We then filtered 481,403 variants that were not in GIAB high confidence regions, had MSQ rank sum not equal to zero or failed gnomAD v3 QC.94 We removed 3,627 variants with a minor allele count of less than 1 after individual-level filters were applied. We removed 695,947 variants that were not autosomal. This final dataset included 20,656,600 variants and 741 individuals.Selection scansiHS and XPEHH were calculated using the hapbin software (https://github.com/evotools/hapbin) with option –max-extend 1000000 and --minmaf 0.05.41 All other options were set to default. To compute P-values, we used the method by Fariello et al. (2013), exploiting the fact that detectable regions under strong selection affect a small portion of the genome.95 For both statistics, values were standardized genome-wide in 2% allele frequency bins, as allele frequency is correlated with allele age and therefore haplotype length.40,43 We first computed outlier-robust mean and standard deviation with the rlm() function from the MASS package in R, to reduce the influence of outliers.95,96 The standardized values of these summary statistics represent z-scores. We calculated two tailed p-values using these z-scores, giving the probability that we observe these data by chance compared to null expectations for the standard normal distribution. Q-Q plots and histograms of p-values for each statistic are provided in the Supplementary Materials (Fig. S9). For each summary statistic distribution, we also calculated the p-value cutoffs that correspond to a False Discovery Rate (FDR) of less than 0.01 and 0.001, using the q-value R package (https://github.com/StoreyLab/qvalue).42 We additionally include the empirical standardized values for each statistic (Fig. S10).EHH decay plots and haplotype furcations for the LCT locus were calculated using the rehh R package (https://cran.r-project.org/web/packages/rehh/index.html)47 and visualized the haplotype structure of the genomic region chr2:135701076-136009184 using haplostrips and plot option -S 3 (https://bitbucket.org/dmarnetto/haplostrips).48Kinship and runs of homozygosityThe kinship matrix in the WGS cohort was calculated using the popkin software (https://github.com/StoreyLab/popkin).36–38 We restricted the analyses to biallelic SNPs with a minor allele frequency of at least 0.01 in at least one subpopulation (i.e. YRI, CHB, FIN, CEU, GBR, TSI, IBS, or FARO), resulting in a dataset of 15,206,409 variants. When calculating the kinship matrix for the Faroese WGS cohort only, we used the rescale_kinship() function, which will change the most recent common ancestor and give different absolute values, but the overall relationship structure in the subpopulation remains the same. Using the same data set, we calculated runs of homozygosity (ROHs) for each individual using bcftools/RoH.97 “Short” ROHs were classified as ROH less than or equal to 300 kb, “medium” as greater than 300kb and less than or equal to 1 Mb, and “long” as greater than 1 Mb.Fine-scale structure estimation using ancient genomesA panel of 616 imputed ancient genomes from Allentoft et al. 2024 (downloaded from https://doi.org/10.17894/ucph.d71a6a5a-8107-4fd9-9440-bdafdfe81455), representing individuals from several European regions (southern Europe, western Europe, northern Europe, eastern Europe, and central Europe) was used for analyses.63 Only samples that were estimated to be no older than 3,000 years old were used. Out of these ancient samples, 11 were excavated in the Faroe Islands, 10 of them are historical samples dated to approximately 250 years old, and 1 of them is dated to be approximately 800 years old.64 The sample location, approximate age, and sources for these samples are listed in Table S5. To consolidate the two panels, we first performed a liftover of the ancient genome VCF files to the GRCh38 reference genome. Following this, we applied quality filters to the dataset (bi-allelic sites MAF > 0.05 and imputation INFO >= 0.5).We used HaploNet - a neural network-based method for performing window-based haplotype clustering across the genome - for fine-scale population structure inference on the combined panel. HaploNet uses a hidden Markov model to find an optimal window-based local ancestry “painting” across a genome, given estimated haplotype cluster likelihoods, haplotype cluster frequencies, and global ancestry proportions.98 The Faroese panel’s haplotype frequencies are very homogeneous and highly differentiated from mainland Europeans. For this reason, under an initial round of unsupervised ancestry estimation, we found that the Faroese individuals captured a major component at first split (K=2). We therefore implemented and utilized a semi-supervised ancestry estimation feature in HaploNet20. We performed haplotype clustering in non-overlapping windows of 512 SNPs, and we used the resulting haplotype cluster likelihoods to perform principal component analysis (PCA) and estimate both global and local ancestry in the Faroese individuals.We performed global ancestry estimation in HaploNet using its EM algorithm to find the maximum likelihood estimates using only ancient European individuals (excluding the Faroese individuals).20 We used the EM algorithm a second time to estimate the ancestry proportions (Q matrix) in the Faroese individuals. The estimated haplotype cluster frequencies (F matrix) were kept fixed, which means that the semi-supervised approach can be seen as modeling the Faroese individuals using inferred haplotype clusters from the ancient European individuals.We estimated the average timing of admixture in modern and ancient Faroese individuals using the DATES software.65 We selected reference individuals from the ancient panel who were maximized for North Europe (n=64) and West Europe (n=41) ancestry, respectively. We obtained separate estimates for the admixture timing in the 11 historical Faroese individuals dated to approximately the 17th century and the 40 modern individuals from the FarGen project. We used the following recommended default options for optimal performance: binsize = 0.001, maxdis = 1.0, jacknife = YES, qbin = 10, runfit = YES, afffit = YES, lovalfit = 0.45.Data availabilityVariant-level summary statistics and genome-wide selection scan results for iHS and XPEHH are available for research via AWS S3 (s3://public.us-prod.variantbio.com/FaroeIslands_SelectionScans/) upon request for research that is in line with informed consent and ethical approval. Genetic and meta data from this study is stored at the Faroese Health Authority. Access to individual-level data is available for research upon participants' re-consent. Researchers will be granted access to de-identified genetic data and metadata, provided that the project protocol has been approved by the Faroese Scientific Ethical Committee and a template material/data transfer agreement has been signed with the Faroese Health Authority in compliance with GDPR (see Gregersen et al., 2021). Requests should be made to Noomi O. Gregersen (noomi@fargen.fo).AcknowledgementsWe thank the participants of the FarGen project. FarGen is supported by the Government of the Faroe Islands. F.R. is supported by a Novo Nordisk Fonden Data Science Ascending Investigator Award (NNF22OC0076816) and by the European Research Council (ERC) under the European Union’s Horizon Europe programme (grant agreements 101077592 and 951385). We also thank Victor Lee with assistance while working with ancient genomic data.Additional informationAuthor ContributionsS.E.C., K.A.W., F.R. and N.O.G. designed the study. N.O.G. and K.D.A. secured ethical permissions, facilitated the inclusion of participants, and oversaw the compliance with ethical standards and protocols. G.A. prepared the data for the genealogy analysis. Ó.M. performed relatedness pruning and sample selection for WGS. L.N.L prepared samples for WGS and performed the WGS analyses. A.E. processed sequencing data, performed imputation, and carried out quality control. I.H. conducted kinship, ROH, and selection scan analyses. A.R.M. carried out ancient admixture and local ancestry analysis. J.M. added functionalities to Haplonet software for semi-supervised admixture and fine-structure analysis. S.E.C., N.M., and F.R. supervised analyses. I.H., S.E.C., and A.R.M. interpreted results and wrote the manuscript. All authors reviewed and contributed to the writing of this manuscript.FundingNovo Nordisk Fonden (NNF) (NNF22OC0076816)Fernando RacimoHORIZON EUROPE European Research Council (101077592)Fernando RacimoEC | Horizon Europe | Excellent Science | HORIZON EUROPE European Research Council (ERC)https://doi.org/10.3030/951385Fernando RacimoAdditional filesSupplementary MaterialsReferences1.Johnston G1975The Faroe Islanders SagaCanada: Oberon Books Google Scholar2.Jorgensen T. H.et al.2004The origin of the isolated population of the Faroe Islands investigated using Y chromosomal markersHum. Genet 115:19–28Google Scholar3.Young G. V. C1979From the Vikings to the Reformation: A Chronicle of the Faroe Islands Up to 1538Nám Google Scholar4.Church M. J.et al.2013The Vikings were not the first colonizers of the Faroe IslandsQuat. Sci. Rev 77:228–232Google Scholar5.Als T. D.et al.2006Highly discrepant proportions of female and male Scandinavian and British Isles ancestry within the isolated population of the Faroe IslandsEur. J. Hum. Genet 14:497–504Google Scholar6.West J. F1972Faroe: The Emergence of a NationLondon: C. Hurst Google Scholar7.Jorgensen T. H.et al.2002Linkage disequilibrium and demographic history of the isolated population of the Faroe IslandsEur. J. Hum. Genet 10:381–387Google Scholar8.Gislason H2023SNP heterozygosity, relatedness and inbreeding of whole genomes from the isolated population of the Faroe IslandsBMC Genomics 24Google Scholar9.Leblond C. S.et al.2019Both rare and common genetic variants contribute to autism in the Faroe IslandsNpj Genomic Med 4:1–10Google Scholar10.Rasmussen J.et al.2014Carnitine levels in 26,462 individuals from the nationwide screening program for primary carnitine deficiency in the Faroe IslandsJ. Inherit. Metab. Dis 37:215–222Google Scholar11.Passa P2002Diabetes trends in EuropeDiabetes Metab. Res. Rev 18:S3–8Google Scholar12.Veyhe A. S.et al.2018Prevalence of type 2 diabetes and prediabetes in the Faroe IslandsDiabetes Res. Clin. Pract 140:162–173Google Scholar13.Burisch J.et al.2014East–West gradient in the incidence of inflammatory bowel disease in Europe: the ECCO-EpiCom inception cohortGut 63:588–597Google Scholar14.Dean L. E.et al.2014Global prevalence of ankylosing spondylitisRheumatology 53:650–657Google Scholar15.Schwartz M.Sørensen N.Brandt N. J.Høgdall E.Holm T1995High incidence of cystic fibrosis on The Faroe Islands: a molecular and genealogical studyHum. Genet 95:703–706Google Scholar16.Joensen P2011Multiple sclerosis: variation of incidence of onset over time in the Faroe IslandsMult. Scler. J 17:241–244Google Scholar17.Hammer T.Nielsen K. R.Munkholm P.Burisch J.Lynge E2016The Faroese IBD Study: Incidence of Inflammatory Bowel Diseases Across 54 Years of Population-based DataJ. Crohns Colitis 10:934–942Google Scholar18.Gregersen N. O.et al.2016Whole-exome sequencing implicates DGKH as a risk gene for panic disorder in the Faroese populationAm. J. Med. Genet. B Neuropsychiatr. Genet 171:1013–1022Google Scholar19.Gregersen N. O.Apol K. D.Weihe P.Steig B. ÁAndorsdóttir G2021FarGen: Bioresource From the Faroe Genome ProjectOpen Journal of Bioresources 8Google Scholar20.Meisner J.Albrechtsen A2022Haplotype and population structure inference using neural networks in whole-genome sequencing dataGenome Res. gr 276813https://doi.org/10.1101/gr.276813.122Google Scholar21.Apol K. D.et al.2022FarGen – participants in the genetic research infrastructure of the Faroe IslandsScand. J. Public Health 50:980–987Google Scholar22.Emde A.-K.et al.2021Mid-pass whole genome sequencing enables biomedical genetic studies of diverse populationsBMC Genomics 22Google Scholar23.Auton A.et al.2015A global reference for human genetic variationNature 526:68–74Google Scholar24.Goyette P.et al.2015High-density mapping of the MHC identifies a shared role for HLA-DRB1*01:03 in inflammatory bowel diseases and heterozygous advantage in ulcerative colitisNat. Genet 47:172–179Google Scholar25.Braun J.Sieper J2023Fifty years after the discovery of the association of HLA B27 with ankylosing spondylitisRMD Open 9:e003102Google Scholar26.Parameswaran P.Lucke M.2024HLA-B27 SyndromesIn: StatPearls Treasure Island (FL): StatPearls Publishing Google Scholar27.Bowness P2015HLA-B27Annu. Rev. Immunol 33:29–48Google Scholar28.Hanson A.Brown M. A2017Genetics and the causes of ankylosing spondylitisRheum. Dis. Clin. North Am 43:401–414Google Scholar29.Dilthey A. T.et al.2019HLA*LA—HLA typing from linearly projected graph alignmentsBioinformatics 35:4394–4396Google Scholar30.Gonzalez-Galarza F. F.et al.2020Allele frequency net database (AFND) 2020 update: gold-standard data classification, open access genotype data and new query toolsNucleic Acids Res 48:D783–D788Google Scholar31.Hurley C. K.et al.2020Common, intermediate and well-documented HLA alleles in world populations: CIWD version 3.0.0Hla 95:516–531Google Scholar32.Robinson J.et al.2020IPD-IMGT/HLA DatabaseNucleic Acids Res 48:D948–D955Google Scholar33.Dillon C. F.Hirsch R2011The United States National Health and Nutrition Examination Survey and the epidemiology of ankylosing spondylitisAm. J. Med. Sci 341:281–283Google Scholar34.Cortes A.et al.2015Major histocompatibility complex associations of ankylosing spondylitis are complex and involve further epistasis with ERAP1Nat. Commun 6Google Scholar35.Brown M. A.et al.1996HLA class I associations of ankylosing spondylitis in the white population in the United KingdomAnn. Rheum. Dis 55:268–270Google Scholar36.Ochoa A.Storey J. D2021Estimating FST and kinship for arbitrary population structuresPLOS Genet 17:e1009241Google Scholar37.Ochoa A.Storey J. D2019New kinship and FST estimates reveal higher levels of differentiation in the global human populationbioRxiv https://doi.org/10.1101/653279Google Scholar38.Ochoa A.Storey J. D2019FST and kinship for arbitrary population structures I: Generalized definitionsbioRxiv https://doi.org/10.1101/083915Google Scholar39.Ceballos F. C.Joshi P. K.Clark D. W.Ramsay M.Wilson J. F2018Runs of homozygosity: windows into population history and trait architectureNat. Rev. Genet 19:220–234Google Scholar40.Voight B. F.Kudaravalli S.Wen X.Pritchard J. K2006A Map of Recent Positive Selection in the Human GenomePLOS Biol 4:e72Google Scholar41.Maclean C. A.Chue Hong N. P.Prendergast J. G2015D. hapbin: An Efficient Program for Performing Haplotype-Based Scans for Positive Selection in Large Genomic DatasetsMol. Biol. Evol 32:3027–3029Google Scholar42.Storey J. D.Tibshirani R2003Statistical significance for genomewide studiesProc. Natl. Acad. Sci 100:9440–9445Google Scholar43.Sabeti P. C.et al.2007Genome-wide detection and characterization of positive selection in human populationsNature 449:913–918Google Scholar44.Fan S.Hansen M. E. B.Lo Y.Tishkoff S. A2016Going global by adapting local: A review of recent human adaptationScience 354:54–59Google Scholar45.Williamson S. H.et al.2007Localizing Recent Adaptive Evolution in the Human GenomePLoS Genet 3:e90Google Scholar46.Sabeti P. C.et al.2002Detecting recent positive selection in the human genome from haplotype structureNature 419:832–837Google Scholar47.Gautier M.Vitalis R.2012rehh: an R package to detect footprints of selection in genome-wide SNP data from haplotype structureBioinformatics 28:1176–1177Google Scholar48.Marnetto D.Huerta-Sánchez E2017Haplostrips: revealing population structure through haplotype visualizationMethods Ecol. Evol 8:1389–1392Google Scholar49.Floerl S.et al.2021Functional and Pharmacological Comparison of Human and Mouse Na+/Taurocholate Cotransporting Polypeptide (NTCP)SLAS Discov. Adv. Life Sci. R D 26:1055–1064Google Scholar50.Vaz F. M.et al.2015Sodium taurocholate cotransporting polypeptide (SLC10A1) deficiency: conjugated hypercholanemia without a clear clinical phenotypeHepatol. Baltim. Md 61:260–267Google Scholar51.Ho R. H.Leake B. F.Roberts R. L.Lee W.Kim R. B2004Ethnicity-dependent polymorphism in Na+-taurocholate cotransporting polypeptide (SLC10A1) reveals a domain critical for bile acid substrate recognitionJ. Biol. Chem 279:7213–7222Google Scholar52.Hagenbuch B.Meier P. J1994Molecular cloning, chromosomal localization, and functional characterization of a human liver Na+/bile acid cotransporterJ. Clin. Invest 93:1326–1331Google Scholar53.Deng M.et al.2016Clinical and molecular study of a pediatric patient with sodium taurocholate cotransporting polypeptide deficiencyExp. Ther. Med 12:3294–3300Google Scholar54.Liu R.et al.2017Homozygous p.Ser267Phe in SLC10A1 is associated with a new type of hypercholanemia and implications for personalized medicineSci. Rep 7Google Scholar55.Ceccaldi R.et al.2015Homologous-recombination-deficient tumours are dependent on Polθ-mediated repairNature 518:258–262Google Scholar56.Yoon J.-H.Roy Choudhury J.Park J.Prakash S.Prakash L2014A role for DNA polymerase θ in promoting replication through oxidative DNA lesion, thymine glycol, in human cellsJ. Biol. Chem 289:13177–13185Google Scholar57.Arana M. E.Seki M.Wood R. D.Rogozin I. B.Kunkel T. A2008Low-fidelity DNA synthesis by human DNA polymerase thetaNucleic Acids Res 36:3847–3856Google Scholar58.Seki M.Marini F.Wood R. D2003POLQ (Pol theta), a DNA polymerase and DNA-dependent ATPase in human cellsNucleic Acids Res 31:6117–6126Google Scholar59.Wood R. D.Doublié S2016DNA polymerase θ (POLQ), double-strand break repair, and cancerDNA Repair 44:22–32Google Scholar60.Thomas C.et al.2023Melanoma-derived DNA polymerase theta variants exhibit altered DNA polymerase activityBbioRxiv https://doi.org/10.1101/2023.11.14.566933Google Scholar61.Yoon J.-H.et al.2019Error-Prone Replication through UV Lesions by DNA Polymerase θ Protects against Skin CancersCell 176:1295–1309Google Scholar62.Pan Q.et al.2021Knockdown of POLQ interferes the development and progression of hepatocellular carcinoma through regulating cell proliferation, apoptosis and migrationCancer Cell Int 21Google Scholar63.Allentoft M. E.et al.2024Population genomics of post-glacial western EurasiaNature 625:301–311Google Scholar64.Margaryan A.et al.2020Population genomics of the Viking worldNature 585:390–396Google Scholar65.Narasimhan V. M.et al.2019The formation of human populations in South and Central AsiaScience 365:eaat7487Google Scholar66.Karczewski K. J.et al.2022Systematic single-variant and gene-based association testing of thousands of phenotypes in 394,841 UK Biobank exomesCell Genomics 2Google Scholar67.George N.et al.2024Expression Atlas update: insights from sequencing data at both bulk and single cell levelNucleic Acids Res 52:D107–D114Google Scholar68.Coletto L. A.et al.2023The Role of Neutrophils in Spondyloarthritis: A Journey across the Spectrum of Disease ManifestationsInt. J. Mol. Sci 24Google Scholar69.Santer R.et al.2001Molecular genetic basis and prevalence of glycogen storage disease type IIIA in the Faroe IslandsEur. J. Hum. Genet 9:388–391Google Scholar70.Norio R2003Finnish Disease Heritage II: population prehistory and genetic roots of FinnsHum. Genet 112:457–469Google Scholar71.Kerminen S.et al.2017Fine-Scale Genetic Structure in FinlandG3 GenesGenomesGenetics 7:3459–3468Google Scholar72.Peltonen L.Jalanko A.Varilo T1999Molecular Genetics the Finnish Disease HeritageHum. Mol. Genet 8:1913–1923Google Scholar73.Sabatti C.et al.2009Genome-wide association analysis of metabolic traits in a birth cohort from a founder populationNat. Genet 41:35–46Google Scholar74.Szpiech Z. A.et al.2013Long runs of homozygosity are enriched for deleterious variationAm. J. Hum. Genet 93:90–102Google Scholar75.Patterson N.et al.2022Large-scale migration into Britain during the Middle to Late Bronze AgeNature 601:588–594Google Scholar76.Burger J.et al.2020Low Prevalence of Lactase Persistence in Bronze Age Europe Indicates Ongoing Strong Selection over the Last 3,000 YearsCurr. Biol 30:4307–4315Google Scholar77.Haldane J. B. S1927A Mathematical Theory of Natural and Artificial Selection, Part V: Selection and MutationMath. Proc. Camb. Philos. Soc 23:838–844Google Scholar78.Svanberg I2021The Importance of Animal and Marine Fat in the Faroese Cuisine: The Past, Present, and Future of Local Food Knowledge in an Island SocietyFront. Sustain. Food Syst 5Google Scholar79.Buckley M. T.et al.2017Selection in Europeans on Fatty Acid Desaturases Associated with Dietary ChangesMol. Biol. Evol 34:1307–1318Google Scholar80.Fumagalli M.et al.2015Greenlandic Inuit show genetic signatures of diet and climate adaptationScience 349:1343–1347Google Scholar81.Andersen M. K.Hansen T2018Genetics of metabolic traits in Greenlanders: lessons from an isolated populationJ. Intern. Med 284:464–477Google Scholar82.Hlusko L. J.et al.2018Environmental selection during the last ice age on the mother-to-infant transmission of vitamin D and fatty acids through breast milkProc. Natl. Acad. Sci 115:E4426–E4432Google Scholar83.Nielsen R.et al.2017Tracing the peopling of the world through genomicsNature 541:302–310Google Scholar84.Moltke I.et al.2014A common Greenlandic TBC1D4 variant confers muscle insulin resistance and type 2 diabetesNature 512:190–193Google Scholar85.Salzer J.et al.2012Vitamin D as a protective factor in multiple sclerosisNeurology 79:2140–2145Google Scholar86.Sintzel M. B.Rametta M.Reder A. T2017Vitamin D and Multiple Sclerosis: A Comprehensive ReviewNeurol. Ther 7:59–85Google Scholar87.Laursen J. H.et al.2015Genetic and environmental determinants of 25-hydroxyvitamin D levels in multiple sclerosisMult. Scler. J 21:1414–1422Google Scholar88.Arge S. V.2015Christianity, churches and medieval Kirkjubøur – contacts and influences in the Faroe IslandsIn: Medieval Archaeology in Scandinavia and Beyond: History, Trends and Tomorrow Aarhus University Press pp. 235–256Google Scholar89.Þráinsson H.2004Faroese: An Overview and Reference GrammarFøroya Fróđskaparfelag Google Scholar90.Sinnwell J. P.Therneau T. M.Schaid D. J2014The kinship2 R package for pedigree dataHum. Hered 78:91–93Google Scholar91.Boppana R.Halldórsson M. M1992Approximating maximum independent sets by excluding subgraphsBIT Numer. Math 32:180–196Google Scholar92.Regier A. A.et al.2018Functional equivalence of genome sequencing analysis pipelines enables harmonized variant calling across human genetics projectsNat. Commun 9Google Scholar93.Olson N. D.et al.2022PrecisionFDA Truth Challenge V2: Calling variants from short and long reads in difficult-to-map regionsCell Genomics 2Google Scholar94.Karczewski K. J.et al.2020The mutational constraint spectrum quantified from variation in 141,456 humansNature 581:434–443Google Scholar95.Fariello M. I.Boitard S.Naya H.SanCristobal M.Servin B2013Detecting Signatures of Selection Through Haplotype Differentiation Among Hierarchically Structured PopulationsGenetics 193:929–941Google Scholar96.Venables W. N.Ripley B. D2002Modern Applied Statistics with SSpringer Google Scholar97.Narasimhan V.et al.2016BCFtools/RoH: a hidden Markov model approach for detecting autozygosity from next-generation sequencing dataBioinformatics 32:1749–1751Google Scholar98.Scheet P.Stephens M2006A Fast and Flexible Statistical Model for Large-Scale Population Genotype Data: Applications to Inferring Missing Genotypes and Haplotypic PhaseAm. J. Hum. Genet 78:629–644Google ScholarArticle and author informationAuthor informationIman Hamid†Variant Bio Inc., Seattle, United StatesORCID iD: 0000-0003-2168-9727†these authors contributed equallyÓlavur Mortensen†FarGen, Department of Research, National Hospital of the Faroe Islands, Tórshavn, Faroe Islands, Centre of Health Science, University of the Faroe Islands, Tórshavn, Faroe IslandsORCID iD: 0000-0002-5172-8128†these authors contributed equallyAlba Refoyo-Martínez†Section for Molecular Ecology and Evolution, Globe Institute, University of Copenhagen, Copenhagen, Denmark†these authors contributed equallyLeivur N LydersenFarGen, Department of Research, National Hospital of the Faroe Islands, Tórshavn, Faroe IslandsAnne-Katrin EmdeVariant Bio Inc., Seattle, United StatesMelissa HendershottVariant Bio Inc., Seattle, United StatesKatrin D ApolFarGen, Department of Research, National Hospital of the Faroe Islands, Tórshavn, Faroe IslandsGuðrið AndorsdóttirFarGen, Department of Research, National Hospital of the Faroe Islands, Tórshavn, Faroe IslandsJonas MeisnerMental Health Centre Copenhagen, Copenhagen University Hospital, Copenhagen, Denmark, Novo Nordisk Foundation Center for Basic Metabolic Research, University of Copenhagen, Copenhagen, DenmarkKaja A WasikVariant Bio Inc., Seattle, United StatesFernando RacimoSection for Molecular Ecology and Evolution, Globe Institute, University of Copenhagen, Copenhagen, DenmarkORCID iD: 0000-0002-5025-2607For correspondence: fracimo@sund.ku.dkStephane E CastelVariant Bio Inc., Seattle, United StatesORCID iD: 0000-0002-0707-2133For correspondence: stephane@variantbio.comNoomi O GregersenFarGen, Department of Research, National Hospital of the Faroe Islands, Tórshavn, Faroe Islands, Centre of Health Science, University of the Faroe Islands, Tórshavn, Faroe IslandsFor correspondence: noomi@fargen.foAuthor NotesCompeting interests: I.H., A.E., M.H., K.A.W., and S.E.C. are employees and options or shareholders of Variant Bio Inc.; K.A.W. and S.E.C. are co-founders of Variant Bio Inc. and S.E.C. is a member of its Board of Directors.Version historySent for peer review: May 21, 2025Preprint posted: May 26, 2025Reviewed Preprint version 1: August 22, 2025Reviewed Preprint version 2: March 6, 2026Cite all versionsYou can cite all versions using the DOI https://doi.org/10.7554/eLife.107428. This DOI represents all versions, and will always resolve to the latest one.Copyright© 2025, Hamid et al.This article is distributed under the terms of the Creative Commons Attribution License, which permits unrestricted use and redistribution provided that the original author and source are credited.Metricsviews533downloads14citations0Views, downloads and citations are aggregated across all versions of this paper published by eLife.

来源:e life发布时间:2025-08-22
model of RVCL-S demonstrates age dependent disease progression

AbstractRetinal vasculopathy with cerebral leukoencephalopathy and systemic manifestations (RVCL-S) is a disease that causes deterioration of small vessels, affecting various organs: eyes, brain, liver, and others. The RVCL-S carriers have lower life expectancy. There is no cure available to date. The disease has been linked to mutations in TREX1 gene disrupting its cytoplasmic localization. To facilitate the disease mechanism investigation, we employed model organism D. melanogaster, identified human TREX1 ortholog cg3165, and confirmed its vital significance to flies. Then, we expressed human TREX1 and its mutant form TREX1 V235Gfs in flies and used optical coherence microscopy (OCM) to monitor the dynamics of flies’ vascular system. We detected the relapse of fly dorsal vessel, movement impairment, and reduced longevity in TREX1 V235Gfs-expressing transgenic animals. Vascular deterioration and shorter life span recapitulate the RVCL-S manifestations in humans. We have established a robust quantitative Drosophila RVCL-S phenotypic system that can potentially serve as a screening platform for drug discovery and drug targets identification.IntroductionRetinal vasculopathy with cerebral leukoencephalopathy and systemic manifestations (RVCL-S, RVCL) represents a very special case among rare diseases. It is classified as an ultra-rare disease since it was detected in approximately 30 unrelated families from different countries across the world (1). The disease manifests in highly vascularized tissues including the central nervous system (CNS), retina, liver, kidney (2). The observed symptoms appear between 35 to 50 years of age. Vision impairment, MRI detected brain abnormalities, proteinuria, and liver disease are among the most common symptoms. The severity of the disease correlates with age, leading to premature death (2). Proper diagnosis can be established only based on molecular DNA analyses, which is not a common approach taken by a family physician. Most likely, RVCL-S is under-diagnosed and has much broader distribution among the population (3).A hereditary syndrome resulting in brain pseudotumors and retinal capillary abnormalities (cerebroretinal vasculopathy, CRV) was first reported and described in 1988 (4). Later, hereditary autosomal dominant vascular retinopathy (HVR), migraine, and Raynaud’s syndrome cases were studied in a large Dutch family (289 family members); the results indicated vascular etiology of this disorder (5). Clinical cases of hereditary endotheliopathy with retinopathy, nephropathy, and stroke (HERNS) were observed in Chinese family (6). HVR, CRV, and HERNS phenotypes were all linked to the same chromosomal region 3p21.1-p21.3 (7). In 2007 these illnesses were designated as retinal vasculopathy with cerebral leukodystrophy (RVCL) and linked to mutations in TREX1 gene resulting in protein C-terminal truncations (8, 9). These mutations are dominant and result in 100% disease penetrance (8). RVCL is not associated with elevated levels of Type I interferons (IFNs) (10). Development of the appropriate therapy remains very challenging, despite the availability of information related to the TREX1 mutations mapping and the protein function. There are no financial incentives for pharmaceutical companies to invest in large scale drug discovery due to the high cost and a small number of RVCL-S patients. One of the directions for RVCL-S treatment development is drug re-purposing, this approach can reduce the time and associated cost. First clinical trial utilizing Aclarubicin, a component of anti-cancer drug cocktails used in China and Japan, to treat RVCL patients started in 2016 (ClinicalTrials.gov, NCT02723448). However, no benefits were observed and the trial did not advance to Phase II (11). Recently, Crizanlizumab, approved for sickle cell anemia treatment, was employed to treat RVCL-S patients in a trial showing a potential to slow the disease progression (12).Using model organisms to create human disease models has been proven to be an indispensable approach to decipher the disease mechanism on molecular and physiological levels and facilitate the treatment development. Introduction of RVCL-S associated mutation mimicking human TREX1 V235G frameshift into a mouse Trex1 gene resulted in increased mortality and vascular phenotypes in homozygous mice; however, not all pathological features of the disease were detected (13). Studies of TREX1 function on molecular level using cell culture approaches revealed TREX1 mediated DNA damage and subsequent senescence induction caused by a nuclear envelope rupture (14). This may occur naturally in highly mechanically solicited tissues (muscles, etc) due to aging, and also in crowded tissues, aka tumors. Chauvin et al. (2024) utilized sophisticated multi-model approach (Drosophila, mouse, and cells) to demonstrate the role of RVCL-S causing TREX1protein in accumulation of DNA breaks, cellular senescence induction and loss of specific cell types (11). Regardless of a significant progress in understanding the link between TREX1 mutations and RVCL symptoms, there is still a need for a robust disease model to perform high throughput drug screenings; for example, FDA approved compound libraries assessment could help to prioritize the drug candidates.Drosophila melanogaster (fruit fly) is an invertebrate model organism with well-studied physiology, behavior, sequenced genome, and availability of sophisticated genetic and biochemical tools. Fruit flies possess significant gene conservation with humans and have been successfully used to create human disease models, including rare disease models (15, 16) (17). RVCL-S linked TREX1 gene has an ortholog in D. melanogaster, cg3165, based on the computational predictions (18). cg3165 is expressed at all developmental stages, as demonstrated by RNA-Seq data (SI Fig. 1)(19–21). cg3165 and human TREX1 belong to 3’-5’ exonuclease, DnaQ-like subfamily. Humans have 2 closely related genes, TREX1 and TREX2, their catalytic domains are 40% identical, but TREX2 does not have extended C-terminal region (22). TREX2 has nuclear localization and plays a role in genome stability (23). The C-terminal region of TREX1 contains the transmembrane domain (TM) anchoring it to perinuclear endoplasmic reticulum (24, 25). TREX1 C-terminal truncations lose their cytoplasmic localization and enter the nucleus causing DNA damage and leading to RVCL-S manifestations (11). cg3165 has significant similarity to TREX1 and TREX2 in N-terminal conserved exonuclease domain, but Alliance of Genome Resources gives higher score to human TREX1 to be an ortholog of D. melanogaster cg3165 (18). cg3165 does not have a TM domain (25), likely using different mechanisms to separate nuclear and cytoplasmic activities.Drosophila is the only invertebrate model that has functional and genetically trackable cardiovascular system (26). Flies have open circulatory system with a dorsal vessel spanning along the anterior-posterior axis (27). We focused our research on creating RVCL-S disease model mirroring genetic aberrations and looking for the phenotypic changes in vascular and other relevant organ systems. Robust phenotypes would be used for creating Drosophila based RVCL-S screening platform. Previously, we applied optical coherence microscopy (OCM) for non-invasive, in vivo visualization of functioning D. melanogaster cardiovascular system, producing images with a micron scale resolution (28–32). The imaging data were efficiently processed using deep-learning-based neural network models to create masks of vessel cross section area and extract relevant cardiovascular functional parameters (33–36).Here, we report the development of an RVCL-S model in D. melanogaster. We confirmed the implication of human TREX1 fly ortholog, cg3165, in dorsal vessel maintenance, neuromotor regulation, and lifespan prolongation. We have generated a transgenic system, enabling expression of human full length TREX1 and RVCL-S associated C-terminus truncated TREX1 V235G fs in flies. The obtained results have demonstrated the detrimental effects of TREX1 V235G fs on dorsal vessel parameters, neuromotor functions and a lifespan. These instruments can be utilized in search efforts for therapeutic agents to counteract the RVCL-S disease progression.ResultsGenetic design of RVCL-S model in D. melanogasterWe have identified Drosophila melanogaster cg3165 as an ortholog of human TREX1 using BLAST and other bioinformatic instruments and searching the genomic and proteomic databases (FlyBase, KEGG, etc.). cg3165 gene structure is shown in Fig. 1A. The first step in generation of RVCL model was aimed to determine the vital significance of cg3165 gene for D. melanogaster. We performed RNAi mediated CG3165 depletion utilizing UAS/GAL4 genetic technique (37) (Table 1). Ubiquitous depletion (Act5C> cg3165RNAi) resulted in reduced longevity (SI Fig. 2A) and flies’ impaired locomotor behavior (SI Fig. 2C), consistent only in males. Cardiac vessel specific depletion in Hand>cg3165RNAi animals did not result in longevity reduction (SI Fig. 2A, B). These initial results, however, suggested the importance of cg3165 for the flies’ health. Next, we designed a series of transgenic lines with various D. melanogaster cg3165 and human TREX1 content in order to optimize and establish a robust genetic system representing the RVCL-S disease state. We have generated several genetic combinations, starting from complete removal of fly CG3165 by CRISPR. Though the complete removal of 3’-5’-DNA exonuclease coded by cg3165 is rather attributable to Aicardi-Goutieres syndrome (38), and is not relevant to the RVCL-S caused by the active enzyme mis-localization, the results obtained with the deletion line were used as a starting point to assess the phenotypic impacts from human TREX1 transgenes. In subsequent steps we gradually added back a copy of cg3165 gene and introduced transgenic human TREX1 variants. hTREX1 transgenes expression levels were regulated by different GAL4 drivers; details are summarized in Table 1.Table 1.Genetic configuration UAS/GAL4 system for RNAi mediated depletion of cg3165 and expression of human TREX1 transgenes in D. melanogaster Females from GAL4 driver lines listed in 1st column were crossed to males shown in the upper row.The resulting copy numbers of fly cg3165 and human TREX1 content of the progeny is described.Figure 1.Schematic presentation of generated transgenic constructs and their confirmation after genomic integration and activation. (A) Genomic region containing cg3165 gene shown in GEP UCSC browser snapshot with selected tracks indicating protein domain, regulatory regions, and RNA-seq coverage. cg3165 CDS shown as thick blue blocks; it was replaced by GAL4-lox-dsRed-lox sequence shown between dashed lines (functional elements are not in scale). Red arrows indicate PCR primers used to confirm cg3165 CDS removal. (B) PCR results confirm the removal of CDS fragment. (C) Transgenic constructs used for establishment of UAS-hTREX1 and UAS-hTREX1 V235G fs Drosophila stocks. Black arrows indicate RT-PCR primers. Primers used for quantitative RT-PCR are shown in green. (D) RT-PCR results confirm hTREX1 and hTREX1 V235G fs expression. Genotypes are shown below the gel images. Act42A gene was used as a reference. Upper panel represents ‘no reverse transcription’ (-RT) control. First lane is the 1 kb Plus DNA Ladder. Primers’ targets are indicated on the right. (E) Quantitative RT-PCR results demonstrate higher expression levels of both TREX1 transgenes when driven by ubiquitous Act5C-GAL4 driver, compared to cg3165-GAL4 driver and show elevated transcription levels of hTREX1 V235G fs compared to hTREX1. Expression levels were normalized to Act42A. Bar graphs represent means with SD; ** p< 0.01; **** p< 0.0001. This panel was created using BioRender.com.We have generated a cg3165 KO-GAL4 strain by knocking out cg3165 protein coding DNA sequence (CDS) and knocking-in a GAL4 activator sequence. This line plays a dual role: it represents a null cg3165 mutant (Fig. 1A-B), and, at the same time, it serves as a GAL4 driver regulated by the remaining 5’UTR of cg3165 gene (Fig. 1A, RAMPAGE evidence track)(39, 40). We utilized this GAL4 driver to activate human TREX1 transgenes in D. melanogaster presumably natural spatiotemporal pattern. Human TREX1 transgenes were assembled as following: full length TREX1 or truncated TREX1 G235V fs DNA sequences were placed under the control of UAS element in Drosophila transformation vector. Both transgenic constructs were incorporated into D. melanogaster genome at attP2 docking site allowing high expression levels (41) when activated by GAL4 drivers (Fig. 1C, Table 1). cg3165-GAL4 or Act5C-GAL4 females were crossed to UAS-hTREX1 and UAS-hTREX1 V235G fs males and produced viable progeny. We confirmed the expression of UAS-hTREX1 and UAS-hTREX1 V235G fs in adult flies (Fig. 1D) and evaluated the RNA levels of both transgenes controlled by cg3165-GAL4 and ubiquitous Act5C-GAL4 (Fig. 1E). As expected, we observed higher transcript levels for Act5C-GAL4 driven transgenes compared to cg3165-GAL4 driven ones. We also noticed strikingly higher expression of RVCL linked hTREX1 V235G fs versus normal hTREX1 under control of both drivers (Fig. 1E). However, we could not detect a truncated hTREX1 V235G fs protein neither with anti-HA (SI Fig. 3A) nor with anti-TREX1(SI Fig. 3B) antibodies by Western blots, where full length hTREX1 produced a band of expected size and intensity (Act5C> TREX1 is brighter that cg3165> TREX1) (SI Fig. 3A-B); these results may reflect the truncated protein instability.CG3165 knock-out affects the fly dorsal vessel physiologyIn RVCL-S patients with diverse symptoms and manifestations, small blood vessels are affected comprehensively. We set up a goal to characterize the parameters change of the only fruit fly’s vessel in response to the presence of RVCL linked human TREX1. To achieve this, we performed a series of genetic manipulations and assessed our disease model at different building steps. We started with the complete removal of fly CG3165. Young seven day old cg3165 KO-GAL4 adults’ dorsal vessels were subjected to OCM imaging, males and females were imaged separately (32). Imaging data quantitation suggests that the physiology of the fly dorsal vessel was changed (Fig. 2, SI Video 1-2, SI Fig. 4). We determined several parameters including heart rates (HR), end diastolic area (EDA), end systolic area (ESA), fractional shortening (FS), and arrhythmicity index (AI).Figure 2.cg3165 knock out affects D. melanogaster dorsal vessel functional parameters. (A) Cross-section and M-mode OCM images of WT and cg3165 KO-GAL4 flies (7 days old males shown). Yellow scale bar is 50 um. (B) End diastolic area (EDA) measurements. (C) End systolic area (ESA)measurements. (D) Fractional shortening (FS) parameters. One week and 5 weeks old flies shown in panels B-D; males are shown as blue shade boxes, females shown as red shade boxes. 1 week old sample sizes: WT males n=30, WT females n=29; cg3165 KO-GAL4 WT males n=30, KO-GAL4 WT females n=26. 5 weeks old sample sizes: WT males n=34, WT females n=35; cg3165 KO-GAL4 males n=36, cg3165 KO-GAL4 females n=34. Statistical significance shown as black brackets. * - p< 0.05; ** - p< 0.01; *** - p< 0.001; **** - p< 0.0001. Panels B and D were created using BioRender.com.cg3165 KO-GAL4 flies demonstrated vessel’s impaired ability to dilate as judged by the EDA measurements; both males and females were affected (Fig. 2B). The average EDA in 1-week-old WT males is 7.7 ± 0.4 x 103 μm2 vs 5.5 ± 0.3 x 103 μm2 in cg3165 KO-GAL4 (both n =30, p <0.0001); the females’ average EDA is 8.8 ± 0.7 x 103 μm2 vs 6.3 ± 0.5 x 103 μm2 respectively (WT n = 29; cg3165 KO-GAL4 n = 30; p < 0.01). This phenotype was observed in young flies (1-week-old) as well as in aged flies (5-week-old). The average EDA in 5-week-old WT males is 7.2 ± 0.3 x 103 μm2 vs 6.0 ± 0.3 x 103 μm2 in cg3165 KO-GAL4 (WT n = 34; cg3165 KO-GAL4 n = 36; p < 0.01); the females’ average EDA is 9.2 ± 0.5 x 103 μm2 vs 7.3 ± 0.4 x 103 μm2 respectively (WT n = 35; cg3165 KO-GAL4 n = 34; p < 0.01).Reduction of the vessel diameter during maximum contraction, ESA, in cg3165 KO flies was observed in 1-week-old females (Fig. 2C); WT 1 week old females ESA average is 4.0 ± 0.4 x 103 μm2 and cg3165 KO-GAL4 is 2.7 ± 0.3 x 103 μm2 (WT n = 29; cg3165 KO-GAL4 n = 26; p < 0.05). One week old males have comparable ESA measurements; WT average is 2.9 ± 0.3 x 103 μm2 and cg3165 KO-GAL4 is 2.8 ± 0.3 x 103 μm2 (WT n = 30; cg3165 KO-GAL4 n = 30; p > 0.05). Five-week-old males and females ESA were not affected by the removal of CG3165 (Fig. 2C).Fractional shortening (FS) parameter reflects Drosophila dorsal vessel contractility; it measures the percentage difference between the diastolic and systolic states of the fly vessel. We observed impaired contracting ability in 1 week old cg3165 null males, FS reduction in females was not statistically significant. However, in older flies, both males and females have demonstrated impaired contractility. In 1-week-old WT males, the average FS is 61.5 ± 2.9 % and FS of cg3165 KO-GAL4 1-week-old males is significantly lower, 51.0 ± 2.6 % (both genotypes n = 30, p < 0.01). FS of WT and cg3165 KO-GAL4 1 week old females is not significantly different, 55.5 ± 3.4 % and 59.0% ± 2.2 % respectively (WT n = 29; cg3165 KO-GAL4 n = 26; p >0.05, Fig. 2D). The average FS in 5-week-old WT males is 62.0 ± 2.7 % vs 54.3 ± 2.1 % in cg3165 KO-GAL4 (WT n = 34; cg3165 KO-GAL4 n = 36; p < 0.05); the females’ average FS is 63.9 ± 2.1% vs 51.9 ± 2.1%, respectively (WT n = 35; cg3165 KO-GAL4 n = 34; p < 0.0001, Fig. 2D).Analyzing the other characteristics of fly cardiovascular system, such as heart rates (HR) and arrhythmicity indexes (AI), we detected no significant effects from CG3165 ablation. Of note, the distinct HR were observed between two age groups (1-week-old and 5-week-old flies). In Drosophila, HR tends to reduce with age (42, 43); we perceived this in WT and cg3165 KO-GAL4 flies comparing 1-week-old with 5-week-old males and females, further validating our research tools (SI Fig. 4A). The rhythmicity (AI) displays of cg3165 KO-GAL4 and WT flies were similar across both age groups (SI Fig. 4B). These results suggest no involvement of cg3165 in heart regulation per se. However, the functioning pattern of the cg3165 KO-GAL4 flies cardiac vessel is noticeably different from the WT and some phenotypic manifestations (EDA, FS) appear to be related to vessel ‘rigidity’ and are age sensitive. Because the most robust changes were observed in EDA values across both sex and age groups, we decided to use primarily EDA read-out in our following experiments.Transgenic hTREX1 rescues the phenotypes caused by cg3165 knock-outAfter we cleared D.melanogaster genome of endogenous CG3165 and ascertained the vascular phenotypes, we introduced transgenic human TREX1 or RVCL-S associated TREX1 V235G fs to test the ability of human TREX1 to rescue the vascular phenotypes caused by the cg3165 knock-out. We crossed cg3165 KO-GAL4 line carrying 0 copies of cg3165 with UAS-hTREX1 or UAS-hTREX1 V235G fs line containing hTREX1 transgene and 2 copies of endogenous cg3165 (SI Fig. 5). Therefore, the resulting cg3165>TREX1 or cg3165>TREX1 V235G fs progeny contains 1 copy of cg3165 and an activated hTREX1 transgene (Table 1, SI Fig. 5). This balanced genetic design was applied to prevent possible negative effects from an introduction of human protein into fly organism.To assess the vascular phenotypes, flies were subjected to OCM imaging; cg3165> hTREX1 (1x cg3165, 1x hTREX1) and cg3165> hTREX1 V235G (1x cg3165, 1x hTREX1 V235G fs) were compared to WT (2x cg3165, 0x hTREX1), cg3165 KO-GAL4 (0x cg3165, 0x hTREX1), and cg3165> yw (1x cg3165, 0x hTREX1). Adult flies’ dorsal vessel was imaged at day 7 (1 week) and day 35 (5 weeks) post eclosure. The EDA measurements are summarized in Fig. 3A-B; SI Video 1-4 contain representative videos. The vessel’s diastolic diameter is increased upon the introduction of a copy of cg3165 and transgenic hTREX1 and TREX1 V235G fs as seen in young males (1-week-old). cg3165 KO-GAL4 average EDA is 5.5 ± 0.3 x 103 μm2 versus 7.0 ± 0.4 x 103 μm2 in cg3165> yw (both n = 30, p < 0.01), 7.5 ± 0.5 x 103 μm2 in cg3165> hTREX1 (n = 26, p < 0.01), and 7.6 ± 0.5 x 103 μm2 in cg3165> hTREX1 V235G (n = 25, p <0.01) (Fig. 3A). One-week-old cg3165> yw, cg3165> hTREX1, and cg3165> hTREX1 V235G females also show statistically larger EDA, compared to cg3165 KO-GAL4 (Fig.3B). However, cg3165> hTREX1 V235G average EDA (n = 29) is smaller than cg3165> yw (n = 30) hemizygous control (8.2 ± 0.4 x 103 μm2 vs 9.9 ± 0.7 x 103 μm2, p < 0.05, Fig. 3B). The aged hTREX1 and hTREX1 V235G transgenic flies (5 weeks after eclosion) demonstrate vascular relapse, as the EDA values of cg3165 >TREX1 and cg3165 >TREX1 V235G fs flies are smaller than in control cg3165 >yw; this effect is observed for both males and females. The average EDA in 5-week-old cg3165> yw males (n = 35) is 8.7 ± 0.4 x 103 μm2 versus 7.5 ± 0.4 x 103 μm2 in cg3165> hTREX1 (n = 36), and 7.0 ± 0.4 x 103 μm2 in cg3165> hTREX1 V235G (n = 35) (p < 0.05 and p < 0.01, respectively); the 5-week-old females’ average EDA in cg3165> yw (n = 36) is 11.4 ± 0.5 x 103 μm2 versus 8.5 ± 0.4 x 103 μm2 in cg3165> hTREX1 (n = 31), and 9.3 ± 0.5 x 103 μm2 in cg3165> hTREX1 V235G fs (n = 34, p< 0.0001 and p<0.01, respectively). However, cg3165> hTREX1 and cg3165> hTREX1 V235G fs EDA remains significantly larger than the EDA of 5-week-old cg3165 KO-GAL4 flies (Fig. 3A-B).Figure 3.EDA reduction, behavioral impairment, and reduced survival probability observed in CG3165 KO flies are restored by transgenic expression of human TREX1 variants. (A) One-week-old males’ EDA is significantly larger in cg3165> yw, cg3165> TREX1, and cg3165> TREX1 V235G fs than in cg3165 KO. Five-week-old males carrying hTREX1 and hTREX1 V235G fs demonstrate reduction of EDA compared to cg3165> yw. (B) One-week-old females’ EDA is significantly larger in cg3165> yw, cg3165> TREX1, and cg3165> TREX1 V235G fs than in cg3165 KO. Five-week-old females carrying hTREX1 and hTREX1 V235G fs demonstrate reduction of EDA compared to cg3165> yw. WT-yw, KO-cg3165 KO-GAL4, KO/+ - cg3165> yw; hTREX1 - cg3165> hTREX1; hTREX1 V235G fs - cg3165> TREX1 V235G fs. 1 week old sample sizes: WT males n=30, KO males n=30, KO/+ males n=30, hTREX1 males n=26, hTREX1 V235G fs males n=25; WT females n=29, KO females n=26, KO/+ females n=30, hTREX1 females n=26, hTREX1 V235G fs females n=29. 5 weeks old sample sizes: WT males n=34, KO males n=36, KO/+ males n=35, hTREX1 males n=36, hTREX1 V235G fs males n=34; WT females n=35, KO females n=34, KO/+ females n=36, hTREX1 females n=31, hTREX1 V235G fs females n=34. (C) cg3165 knock-out males show impaired locomotor behavior compared to WT (yw); hemizygous cg3165 (cg3165> yw) males demonstrate significant improvement. hTREX1 introduction (cg3165> hTREX1) results in climbing ability improvement comparable to WT levels. Males carrying RVCL-S associated hTREX1 V235G fs (cg3165> TREX1 V235G fs) demonstrate partial climbing ability restoration. (D) cg3165 knock-out females show impaired climbing compared to WT (yw). Normal locomotor behavior is observed in cg3165> yw, cg3165> TREX1, and cg3165> TREX1 V235G fs animals. Bar graphs (A-B) show means with SD. (E) Kaplan-Meier survival curves of cg3165 KO, cg3165 >yw, cg3165 >hTREX1 and cg3165 > hTREX1 V235G fs males. Survival rates of cg3165 knock-out males are significantly reduced. Upon introduction of 1 copy of cg3165 (cg3165 >yw) and transgenic hTREX1 (cg3165 >hTREX1), or hTREX1 V235G fs (cg3165 > hTREX1 V235G fs) the survival probability is increased. (F) Kaplan-Meier survival curves of cg3165 KO, cg3165 >yw, cg3165 >hTREX1 and cg3165 > hTREX1 V235G fs females. Survival rates of cg3165 knock-out females are significantly reduced. Upon introduction of 1 copy of cg3165 (cg3165 >yw) and transgenic hTREX1 (cg3165 >hTREX1), or hTREX1 V235G fs (cg3165 > hTREX1 V235G fs) the survival probability is increased. hTREX1 introduction has the strongest impact on longevity; hTREX1 V235G fs effect is the weakest. Statistical significance shown as black brackets.: * - p< 0.05; ** - p< 0.01; *** - p< 0.001; **** - p< 0.0001. Panels A–D were created using BioRender.com.Analyzing the EDA phenotypes in current hTREX1 expression system, we observed the rescue by the hTREX1 and hTREX1 V235G fs of a vascular phenotype caused by CG3165 knock-out, though we did not detect the significant differences between the full length hTREX1 and hTREX1 V235G fs efficiency. Comparing 1-week and 5-week post eclosure groups we noticed aging-related detrimental effects caused by hTREX1 V235G fs, and also by a full length hTREX1 in males and females (Fig. 3A-B).RVCL affects multiple organ systems and has neurological manifestations including brain dysfunction (9). Fruit flies’ survival greatly depends on their motor functions; this is achieved by tight coordination between the CNS processing external signals and sending instructions, motor neurons, and muscles performing certain actions. Disruption of these processes results in motor defects (44). We performed a climbing assay to test the ability of TREX1 mutant to maintain a normal behavioral pattern of negative geotaxis. We observed that the cg3165 knock-out resulted in significantly impaired climbing ability of cg3165 KO-GAL4 flies; climbing index dropped from WT 72.0 ± 9.2% to 10.1 ± 1.7% (p < 0.0001) in cg3165 KO-GAL4 males; from 89.1 ± 1.8% to 37.6 ± 3.7% (p < 0.0001) in females (Fig. 3C-D), suggesting that the cg3165 gene plays a broad role affecting the neurological networks and/or muscle tissue condition. The climbing ability has significantly improved in hemizygous cg3165 >yw (climbing index is 44.0 ± 4.5% for males (p < 0.001), 84.1 ± 11.5% (p < 0.0001) for females) and in flies expressing both hTREX1 variants: cg3165 >hTREX1 (75.0 ± 5.7%, p < 0.0001 for males; 89.9 ± 1.8%, p < 0.0001 for females), cg3165 >hTREX1 V235G fs flies (50.7 ± 2.5% (p < 0.0001) for males; 98.9 ± 1.0% (p < 0.0001) for females) (Fig. 3C-D). In particular, males show remarkable gene dose sensitivity in restoration of locomotor behavioral patterns. Adding hTREX1 transgenic copy significantly increased the climbing index compared to cg3165 KO-GAL4 and cg3165 >yw, while the effect from RVCL-S associated hTREX1 V235G fs was significantly less compared to hTREX1 carrying flies (Fig. 3C).Lifespan is a robust indicator of aging rates in fly population. We performed the longevity study (25C, 70 % humidity) to determine the effects of cg3165 knock-out and introduction of human transgenic copies of full length or truncated hTREX1 forms. Our initial experiments implied that CG3165 depletion reduced the lifespan, but only in males (SI Fig. 2A). Complete CG3165 removal significantly reduces the life span of cg3165 KO-GAL4 flies (Fig. 3E-F, SI Table 1), males and females, compared to cg3165 >yw (p < 0.0001 for males, p < 0.0001 for females), cg3165 >hTREX1 (p < 0.0001 for males, p < 0.0001 for females) and cg3165 > hTREX1 V235G fs flies (p < 0.0001 for males, p < 0.0001 for females). Survival probability was increased in cg3165 >hTREX1 females, compared to cg3165 >yw control (p < 0.01, Fig. 3F, SI Table 1); females carrying RVCL associated hTREX1 V235G fs demonstrate reduced longevity compared to cg3165 >yw (p < 0.01), and to cg3165 >hTREX1 (p < 0.0001). cg3165 >yw, cg3165 KO-GAL4>hTREX1 and cg3165 >hTREX1 V235G fs males show similar lifespan patterns (Fig. 3E), close to average Drosophila melanogaster male lifespan at 25C (45).Over-expression of human TREX1 transgenes show the age dependent phenotypesTo enhance the phenotypic effects from the ectopic hTREX1 and hTREX1 V235G fs expression we decided to use strong ubiquitous Act5C-GAL4 driver to increase the transgene transcription rates (Fig. 1E). We performed crosses between Act5C-GAL4 females and UAS-hTREX1 and UAS-hTREX1 V235G fs males (Table 1, SI Fig.6). One needs to point out, that these genetic configurations include 2 copies of cg3165 (SI Fig. 6), not 1, as in cg3165 >hTREX1 and cg3165 >hTREX1 V235G fs flies (Table 1, SI Fig.5). Higher Act5C-GAL4 driven UAS-hTREX1 and UAS-hTREX1 V235G fs expression levels compared to cg3165 >hTREX1 and cg3165 >hTREX1 V235G fs flies’ levels (Fig. 1E) did not lead to an increased lethality during early developmental stages of hTREX1 and hTREX1 V235G fs expressing progeny compared to non-transgenic siblings. Obtained Act5C >hTREX1 V235G fs flies’ longevity measurements have shown notably shorter lifespan relative to Act5C>hTREX1 (p < 0.0001 for males and p < 0.0001 for females), and Act5C>yw animals (p < 0.0001 for males and p < 0.001 for females) (Fig. 4A-B, SI Table 2). hTREX1 expressing females have demonstrated increased longevity compared to control Act5C>yw (p < 0.001) (Fig. 4B), while Act5C >hTREX1 males’ lifespan was similar to the control Act5C>yw males (p > 0.05) (Fig. 4A). These results clearly demonstrate the negative effects of RVCL-S linked hTREX1 V235G fs on flies’ survival probability.Figure 4.Over-expression of RVCL linked hTREX1 V235G fs reduces survival probability, movement impairment, and decrease of dorsal vessel EDA. In aged flies, over-expression of ‘healthy’ hTREX1 transgene negatively affects climbing ability and results in smaller EDA. (A) Kaplan-Meier survival curves of Act5C>yw (blue line), Act5C>hTREX1 (orange line) and Act5C >hTREX1 V235G fs (yellow line) males. (B) Kaplan-Meier survival curves of Act5C>yw (blue line), Act5C>hTREX1 (orange line) and Act5C >hTREX1 V235G fs (yellow line) females. C- Climbing assay results in Act5C>yw, Act5C>hTREX1, Act5C >hTREX1 V235G fs males. D- Climbing assay results in Act5C>yw, Act5C>hTREX1, Act5C >hTREX1 V235G fs females. Bar graphs (C, D) represent means with SEM. (D) End Diastolic Area (EDA) measurements of Act5C>yw, Act5C>hTREX1, Act5C >hTREX1 V235G fs males. (E) End Diastolic Area (EDA) measurements of Act5C>yw, Act5C>hTREX1, Act5C >hTREX1 V235G fs females. 1 week old groups sample sizes: Act5C>yw males n=29, Act5C>hTREX1 males n=29, Act5C >hTREX1 V235G fs males n=28; WT females n=30, hTREX1 females n=29, Act5C >hTREX1 V235G fs females n=26. 5 week old groups sample sizes: Act5C>yw males n=25, Act5C>hTREX1 males n=32, Act5C >hTREX1 V235G fs males n=30; Act5C>yw n=35, Act5C>hTREX1 females n=36, Act5C >hTREX1 V235G fs females n=34. Statistical significance shown as black brackets. * - p< 0.05; ** - p< 0.01; *** - p< 0.001; **** - p< 0.0001. Panels C–F were created using BioRender.com.Behavioral tests were performed on aging flies, from week 1 to week 4 after eclosion, to assess the effect of mutant hTREX1 V235G fs over-expression (Fig. 4C-D). Impaired climbing ability was observed in Act5C >hTREX1 V235G fs males starting from the young age, at week 1 and persisted to the end point. Act5C >hTREX1 V235G fs females started showing the moving impairment much later, at week 4. The Act5C>hTREX1 and Act5C >hTREX1 V235G fs flies’ responses to climbing challenge were similar to the results observed for 1 week old cg3165 >hTREX1 and cg3165 >hTREX1 V235G fs flies (Fig. 3C-D). Males were more sensitive to the detrimental effect of RVCL-S linked hTREX1 mutation. We also noticed the age correlated negative impact from hTREX1 over-expression in both males and females, at week 4 after eclosion, compared to Act5C>yw control (Fig. 4C).Considering the physiological impacts of hTREX1 isoforms over-expression, we performed the OCM imaging of flies’ cardiovascular system at week 1 and week 5 after eclosion. The EDA measurements extracted from the processed imaging data are summarized in Fig. 4E-F, SI Video 5-7. At week 1, we observed the EDA reduction in Act5C >hTREX1 V235G fs (RVCL) males (6.0 ± 0.3 x 103 μm2, n = 28) relatively to control Act5C>yw (7.2 ± 0.4 x 103 μm2, n = 29, p < 0.05) and Act5C>hTREX1 (7.5 ± 0.4 x 103 μm2, n = 29, p < 0.005) (Fig. 4E); females average EDA were: Act5C>yw - 9.0±0.5 x 103 μm2 (n = 30), Act5C>hTREX1 - 9.2 ± 0.5 x 103 μm2 (n = 29), Act5C>hTREX1 V235G fs - (8.6 ± 0.5 x 103 μm2, n = 26); the EDA reduction in Act5C>hTREX1 V235G fs females is not statistically significant (p>0.05) (Fig. 4F). At week 5, we continued to see EDA reduction in males carrying hTREX1 V235G fs (RVCL). The average EDA of Act5C>hTREX1 V235G fs 5-week-old males are 4.8± 0.4 x 103 μm2 (n = 30). It is significantly smaller than the average EDA of 5-week-old Act5C>yw males (7.8 ± 0.4 x 103 μm2, n = 35, p < 0.0001), and the average EDA of 5-week-old Act5C>hTREX1 males (6.7 ± 0.3 x 103 μm2, n = 32, p < 0.001). We also observed the negative effects on EDA in aged Act5C>hTREX1 males, expressing ‘healthy’ hTREX1. The average EDA of 5-week-old Act5C>hTREX1 males (6.7 ± 0.3 x 103 μm2, n = 32) is smaller than the average EDA of 5-week-old Act5C>yw males, (7.8 ± 0.4 x 103 μm2, n = 35, p < 0.05, Fig. 4E). The detrimental effect of hTREX1 V235G fs expression became evident in aged females. The average EDA of Act5C>hTREX1 V235G fs 5-week-old females are 7.3 ± 0.4 x 103 μm2 (n= 34). It is significantly smaller than the average EDA of 5-week- old Act5C>yw females (10.2 ± 0.4 x 103 μm2, n = 35, p < 0.0001), and the average EDA of 5-week-old Act5C>hTREX1 females (10.0 ± 0.4 x 103 μm2, n = 36, p < 0.0001) (Fig. 4F).Overall, the longevity test, behavioral assays, and OCM imaging results point to the hTREX1 V235G fs as an adverse modulator of physiological processes in adult flies.DiscussionWe took advantage of Drosophila melanogaster genetic capability and an innovative imaging technology, OCM, to create an RVCL-S disease model that will facilitate the screening for therapeutics and could be used to study the disease progression. We have identified D. melanogaster ortholog of human TREX1 gene linked to the disorder, cg3165, and confirmed its significance for the flies’ vital functions. The removal of cg3165 CDS lead to fly’s cardiovascular system changes comprehensively evaluated by OCM. Dorsal vessel parameter deviations were used as a phenotypic read-out for the RVCL-S fly model building, where the end diastolic area (EDA) proved to be the most robust.Drosophila transgenic lines, carrying the full length human TREX1 and RVCL-S associated truncated TREX 1 V235G fs were generated. We focused our efforts on uncovering the distinct phenotypes caused by the full length and the mutant hTREX1. We detected that the flies’ vascular integrity was restored upon the introduction of both human TREX1 transgenes and/or a copy of cg3165 (Fig. 3, SI Fig. 5) compared to cg3165 null. However, we could not distinguish between the impacts from the hTREX1 and hTREX1 V235G fs at this point, the EDA parameters of cg3165> hTREX1 and cg3165> hTREX1 V235G fs animals were similar.We extended our assays to behavioral tests based on the rational that RVCL-S affects cerebral functions (1). Upon cg3165 knock-out, flies have demonstrated a significant movement impairment at week 1 after eclosure compared to the WT (Fig. 3C-D). Adding a copy of cg3165, hTREX1, or hTREX1 V235G fs improved the climbing ability compared to the cg3165 KO. In males, we observed gradual effects: cg3165 >yw demonstrated some improvement; hTREX1 carrying flies’ climbing index was the highest; but hTREX1 V235G fs flies’ climbing ability was significantly lower than of hTREX1 carrying animals. These results suggested strong positive correlation between Drosophila neuromotor regulation and transgenic hTREX1 presence and a negative impact from hTREX1 V235G.In addition to the experiments scrutinizing the organ specific functions related to the RVCL-S, we performed a longevity study of flies with various hTREX1 genetic content (Fig. 3E-F). cg3165 KO animals are homozygous viable, but their lifespan is significantly shorter. Adding back cg3165, hTREX1, or hTREX1 V235G fs prolongs the lifespan. The impact is higher in cg3165> hTREX1 and is less in cg3165> hTREX1 V235G fs flies relatively to the cg3165>yw control as seen in females. Longevity is not a phenotype that can be used for screening purposes, but it is very reliable method to strengthen the RVCL-S model in Drosophila. RVCL-S patients have decreased life expectancy (2), and our results with hTREX1 V235G fs carrying flies reflect this disease aspect.Following the observed trends in our results, we changed the genetic content of the experimental setup; instead of maintaining the gene expression pattern and copy numbers (1 copy of endogenous cg3165 and a human hTREX1/ hTREX1 V235G fs transgene controlled by 5’UTR cg3165), we utilized ubiquitous Act5C-GAL4 driver to over-express human TREX1 constructs (SI Fig. 6) anticipating to obtain more robust phenotypes. The longevity evaluation of Act5C>yw (control), Act5C> hTREX1, and Act5C> hTREX1 V235G fs flies re-confirmed the negative impact of hTREX1 V235G fs expression on Drosophila survival rates (Fig. 4A-B). The locomotor behavior tests performed during week 1 through week 4 demonstrated progressive impairment of climbing ability of hTREX1 V235G carrying males relatively to hTREX1 carrying and control animals (Fig. 4C).The OCM imaging results of Act5C>yw, Act5C> hTREX1, and Act5C> hTREX1 V235G fs clearly demonstrated the detrimental effect of hTREX1 V235G fs on dorsal vessel dilation in 1-week-old males compared to hTREX1 and ‘no transgene’ control (Fig. 4E). Considering the late onset of RVCL-S manifestations in humans, in aged (5-week-old) flies, we detected the TREX1 V235G fs facilitated the EDA reduction in both males and females (Fig.4E-F).To build an RVCL-S research model, we devised two Drosophila UAS/GAL4 expression systems of human TREX1 and TREX1 V235G fs proteins: cg3165 and Act5C promoter based. The Act5C over-expression approach proved to be more efficient to detect the detrimental effect of RVCL-S linked hTREX1 V235G fs on vascular phenotypes. But the more robust EDA phenotype appearance could also be affected by the fly cg3165 gene copy numbers in the background (i.e., amount of 3’-5’-DNA exonuclease). McGlasson et al. (2025) have recently shown that mono-allelic truncating mutations in TREX1 require intact nuclease activity in order to cause endothelial disease (46). The EDA measurements, shown in Fig. 3A-B, do not indicate any differences between cg3165> hTREX1 and cg3165> hTREX1 V235G fs animals in any sex or age groups. Meanwhile, the dorsal vessel deterioration (smaller EDA) in Act5C> hTREX1 V235G fs is obvious in young and aged males, and aged females, compared to of Act5C> hTREX1 (Fig. 4E-F). The absence of EDA phenotypic differences in the 1st case correlates with cg3165 haplodeficiency (SI Fig. 5) and, therefore, lower level the exonuclease activity. The Act5C based expression system includes two copies of cg3165 (SI Fig. 6) and has higher levels 3’-5’-DNA exonuclease most likely contributing to the stronger effects in Act5C> hTREX1 V235G fs flies.RVCL-S manifestations increase with aging leading to premature death (2). Comparing two Drosophila age groups (1 week and 5 weeks after eclosure), we noticed the vessel deterioration in older flies carrying full length hTREX1 compared to the ‘no transgene’ controls (Fig.3A-B and Fig. 4E). Similar observations were made by Chauvin et al. (2024) (11) when hTREX1 was expressed in D. melanogaster eye tissue and caused a rough phenotype, though less severe that of RVCL-S isoform, but distinct from the normal state. The authors observed hTREX1 nuclear mis localization, however less pronounced than in hTREX1 V235G fs containing cells. The vascular damage in aged hTREX1 carrying flies might occur as a consequence of hTREX1 mis localization to the nucleus by the mechanisms described in (14) due to significant mechanical stress within the vessel tissues.In summary, we have created an experimental methodology aimed to facilitate the development of a treatment for a rare genetic disorder, RVCL-S. Current work represents an interdisciplinary approach, where humans’ medical problems are addressed using Drosophila model organism through the methods of genetics, bioinformatics, biophysics and others. Through optimization of these tools, we have built a model that in the future could be used for testing chemical compounds. Our system also allows us to conduct further research on molecular level to identify the druggable gene targets.Materials and methodsDrosophila stocksFly stocks were maintained on standard cornmeal media at room temperature. y[1] w[*]; P{Act5C-GAL4-w}E1/CyO driver was obtained from Bloomington Drosophila Stock Center, stock #25374. cg3165 CDS deletion and GAL4 knock-in was achieved by CRISPR and performed by WellGenetics (Taiwan) resulting in w1118; cg3165KO GAL4 loxP RFP loxP/ CyO stock. To create transgenic stocks carrying human TREX1 gene, we used a plasmid pcDNA3.1 N-HA-human TREX1 (WT) provided by Jonathan Miner (University of Pennsylvania Perelman School of Medicine) as a source. We performed seamless cloning using NEBuilder® HiFi DNA Assembly Master Mix (NEB, E2621S). HA-hTREX1 DNA fragment was amplified with 5’-GGG AAT TGG GAA TTC GTT AAC ACT AGC GTT TAA ACT TAA GCT TGC CAC CAT GTA CCC-3’ and 5’-ATC CTC TAG AGG TAC CCG CGG CCG CCA CTG TGC T-3’ primers and assembled with pUAST-attB (#1419, DGRC) cut with XhoI, BglII. To create transgenic stocks carrying human TREX1 G235V fs gene we used a plasmid pcDNA3.1 hTREX1 V235Gfs C-HA provided by Jonathan Miner. hTREX1 V235Gfs C-HA DNA fragment was amplified with 5’-TAG GGA ATT GGG AAT TCG TTA ACA CTA GCC ACC ATG GG-3’ and 5’-ATC CTC TAG AGG TAC CCA GCG GGT TTA TCA AGC GTA AT-3’ and assembled with pUAST-attB/ XhoI, BglII. Resulting Drosophila transformation vectors were microinjected into fly embryos by BestGene Inc. Phi31 mediated cassette exchange occurred at attP2 landing pad. Transgenes integration was verified by PCR and sequencing. yw; UAS-HA-hTREX1 w+ y+t7.7 attP2/TM6B and yw; UAS-hTREX1 V325G fs w+ y+t7.7 attP2/TM6B stocks were established.Genetic crossesw1118; cg3165KO GAL4 loxP RFP loxP/ CyO females were crossed to yw; UAS-HA-hTREX1 w+ y+t7.7 attP2/TM6B or yw; UAS-hTREX1 V325G fs w+ y+t7.7 attP2/TM6B. Non-Cy, non-Tb progeny were collected for the experiments. Non-Cy progeny from w1118; cg3165KO GAL4 loxP RFP loxP/ CyO and yw cross served as the genetic control.yw; P{Act5C-GAL4-w}E1/CyO females were crossed to yw; UAS-HA-hTREX1 w+ y+t7.7 attP2/TM6B Tb. Non-Cy, non-Tb progeny was collected for imaging and other experiments. Same crossing scheme was applied for hTREX1 G235V fs carrying flies. Non-Cy progeny from yw; P{Act5C-GAL4-w}E1/CyO and yw cross served as the genetic control.OCM imagingAdult flies were imaged using our custom-built SD-OCM system. Broadband light was sent from a super luminescent diode (SLD) with a center wavelength of 850 nm and a bandwidth of 165 nm (Superlum, cBLMD-T-850-HP). A 10x objective focused light onto the sample stage. Light interference from sample and reference arms was measured using a spectrometer and 2048-pixel line-scan camera (Wasatch Photonics, CS800-840/180-80-OC2K-U3). The lateral resolution was measured as ∼2.8 µm and the axial resolution was ∼3.3 µm in tissue. Measured system sensitivity was ∼95.1 dB.Flies were fixed to a glass slide by attaching their wings to the slide with rubber cement (Elmer’s, Rubber Cement). The OCM beam was positioned over the A1 segment of the heart. M-Mode imaging was performed using 128 A scans and 2000 B scans with an exposure time of 50 µs and a frame rate of 125 frames per second, for an approximately 16-second-long recording per collection.OCM image processingRaw OCM data was processed into images using custom lab MATLAB code. To quantify relevant heart parameters, the heart area was segmented in each image using FlyNet3.0 to create masks of the heart area. Once masks were created, they were resized, such that each pixel was equivalent to 1 micron. Heart area over time was plotted, and peak (maximum area) and valley (minimum area) points were identified. Heart rate was calculated using the inverse of the distance between valley areas. End diastolic area (EDA) was calculated as the average area in µm3 at each peak, and end systolic area (ESA) was calculated as the average area in µm3 at each valley. Fractional shortening (FS) was calculated using the following equation: PCRhTREX1 transgenes were verified by PCR using GoTaq Master Mix (Promega, M7122) and primers 5’-CCT GCA GGTCGGAGT ACT GT-3’ and 5’-GGA AAG TCC TTG GGG TCT TC-3’ following manufacturer’s instructions.RT-PCRTotal RNA was extracted from adult flies using TRI Reagent (Sigma-Aldrich, T9424-25ML) according to manufacturer’s instructions. cDNA synthesis was performed using QuantiTect Reverse Transcription Kit (Qiagen, 205311) according to the manual. Gene specific PCRs were done using GoTaq Master Mix and primers 5’-AGC GAG ATC ACA GGT CTG AG-3’ and 5’-ACC ACT GCT CCC AT CAT CA-3’ to detect hTREX1 transgenes, and 5’-TGC CCA TTT ATG AGG GCT AC-5’ and 5’-ATC TCC TGC TCG AAG TCC AA-3’ specific for Actin 42A gene serving as a control. qRT-PCR was performed on StepOnePlus System (Applied Biosystems) using QuantiTect SYBR Green PCR Kit (Qiagen, 204143) and hTREX1 specific primers, 5’-GCATGGGCGTCAATGTTTTG-3’ and 5’-TGCTATCCACACAGAAGGCA-3’. Actin 42A gene served as reference.Western blotsTotal protein extracts were obtained from adult flies as follows: flies were homogenized in 1X Laemmli Sample Buffer (Bio-Rad, 1610737) and boiled for 5 min. Proteins were resolved by size in 10% SDS-PAGE and transferred to nitrocellulose membrane (Bio-Rad, 1620112). Membranes we blocked in 5% Blotto (Santa Cruz Biotechnology, sc-2324) in TBS-T. Anti-HA rMs-IgG1-s (DSHB) antibodies were used at 1:1,000 dilution; anti-LaminC (LC28.26-s, DSHB) at 1:1,000; anti-TREX1 (D8E2O) Rabbit mAb #15107 (Cell Signaling Technology) in 2.5% Blotto. Secondary Peroxidase- conjugated AffiniPure Goat Anti-mouse IgG (Jackson ImmunoResearch, 115-035-003) or Peroxidase-conjugated AffiniPure Goat Anti-rabbit IgG (Jackson ImmunoResearch, 111-035-003) were diluted to 1:100,000. SuperSignal™ West Femto Maximum Sensitivity Substrate (Thermo Scientific, 34095) was used for signal development. Signal visualization was performed on iBright750 imaging system.Climbing assay20 flies were placed in an empty vial, left to recover from CO2 anesthesia for ∼15 min, gently banged down to bring the flies to the bottom of the vial and then flies were let to climb up the wall. Short videos were recorded and used to calculate the percentage of flies crossed the horizontal line drawn at 2.5 cm height at 10 sec. Multiple vials were taped together. Males and females were tested separately. Bar graphs were created in https://BioRender.com.Longevity assay100 males and 100 females eclosed within 24h were placed in fresh vials, 33-34 flies per vial and kept at 25C 70% humidity. Flies transfer was done every 3-4 days; numbers of dead flies were recorded.Statistical analysesFor climbing assay and heart function analyses, two-sample student’s t tests were performed with a 95% confidence level. For longevity assay, the age of flies was tracked for each dataset, and we calculated the Kaplan-Meier survival curve, and performed a log-rank test and two-sample two-tailed t-test, also with a 95% confidence level.Data availabilityData underlying the results presented in this paper are not publicly available at this time but may be obtained from the authors upon reasonable request.Additional informationFundingThis research was supported by National Institutes of Health grant R01-HL156265 (C. Z.); National Institutes of Health grant R01AI143982 (J.J.M.); National Institutes of Health grant R01NS131480 (J.J.M.); Clayco Foundation Innovative Research Award (C. Z.); gift from the Clayco Foundation (J.J.M.); National Science Foundation Graduate Research Fellowship Program (A. Matt); Washington University in St. Louis startup fund (C. Z.); Penn Colton Center for Autoimmunity pilot award (J.J.M.); Penn RVCL Sisters Fund (J.J.M.).We thank Joanna Chen and Dante Zou for their help with the experiments. We are very grateful to the organizers and participants of the first International RVCL-S Meeting (Leiden, Netherlands, 2024) for helpful and enriching discussions.FundingHHS | National Institutes of Health (NIH) (R01-HL156265)Chao ZhouHHS | National Institutes of Health (NIH) (R01AI143982)Jonathan J MinerHHS | National Institutes of Health (NIH) (R01NS131480)Jonathan J MinerClayco Foundation (Innovative Research Award)Chao ZhouClayco FoundationJonathan J MinerNSF | National Science Foundation Graduate Research Fellowship Program (GRFP)Abigail MattWashington University in St. Louis (WashU) (Startup fund)Chao ZhouPenn Colton Center for Autoimmunity pilot awardJonathan J MinerPenn RVCL Sisters FundJonathan J MinerAdditional filesSupplementary information. SI Fig.2C-D (https://BioRender.com/53wapsg) and SI Fig.4 (https://BioRender.com/1d5mnfb) were created using BioRender.com.Supplementary video 1. Dorsal vessel crossection of WT (yw) male. Yellow scale bar is 50 um.Supplementary video 2. Dorsal vessel crossection of cg3165 KO male. Yellow scale bar is 50 um.Supplementary video 3. Dorsal vessel crossection of cg3165> hTREX1 male. Yellow scale bar is 50 um.Supplementary video 4. Dorsal vessel crossection of cg3165> hTREX1 V235G fs male. Yellow scale bar is 50 um.Supplementary video 5. Dorsal vessel crossection of Act5C> yw male. Yellow scale bar is 50 um.Supplementary video 6. Dorsal vessel crossection of Act5C> hTREX1 male. Yellow scale bar is 50 um.Supplementary video 7. Dorsal vessel crossection of Act5C> hTREX1 V235G fs male. Yellow scale bar is 50 um.References1.Wilms A. E.de Boer I.Terwindt G. M.2022Retinal Vasculopathy with Cerebral Leukoencephalopathy and Systemic manifestations (RVCL-S): An update on basic science and clinical perspectivesCereb Circ Cogn Behav 3:100046Google Scholar2.Stam A. H.et al.2016Retinal vasculopathy with cerebral leukoencephalopathy and systemic manifestationsBrain 139:2909–2922Google Scholar3.de Boer I.Pelzer N.Terwindt G.2019Retinal Vasculopathy with Cerebral Leukoencephalopathy and Systemic ManifestationsIn: Adam M. P.et al, editors. GeneReviews Seattle: University of Washington Google Scholar4.Grand M. G.et al.1988Cerebroretinal VasculopathyOphthalmology 95:649–659Google Scholar5.Terwindt G.1998Clinical and genetic analysis of a large Dutch family with autosomal dominant vascular retinopathy, migraine and Raynaud’s phenomenonBrain 121:303–316Google Scholar6.Jen J.et al.1997Hereditary endotheliopathy with retinopathy, nephropathy, and stroke(HERNS)Neurology 49:1322–1330Google Scholar7.Ophoff R. A.et al.2001Hereditary Vascular Retinopathy, Cerebroretinal Vasculopathy, and Hereditary Endotheliopathy with Retinopathy, Nephropathy, and Stroke Map to a Single Locus on Chromosome 3p21.1-p21.3The American Journal of Human Genetics 69:447–453Google Scholar8.Richards A.et al.2007C-terminal truncations in human 3′-5′ DNA exonuclease TREX1 cause autosomal dominant retinal vasculopathy with cerebral leukodystrophyNat Genet 39:1068–1070Google Scholar9.Wilms A. E.et al.2024NFL and GFAP in (pre)symptomatic RVCL-S carriers: a monogenic cerebral small vessel diseaseJ Neurol 271:4138–4145Google Scholar10.Rodero M. P.et al.2017Detection of interferon alpha protein reveals differential levels and cellular sources in diseaseJournal of Experimental Medicine 214:1547–1555Google Scholar11.Chauvin S. D.et al.2024Inherited C-terminal TREX1 variants disrupt homology-directed repair to cause senescence and DNA damage phenotypes in Drosophila, mice, and humansNat Commun 15:4696Google Scholar12.Wang W. X.et al.2024Crizanlizumab for retinal vasculopathy with cerebral leukoencephalopathy in a phase II clinical studyJ Clin Invest 134Google Scholar13.Mulder I. A.et al.2020Increased Mortality and Vascular Phenotype in a Knock-In Mouse Model of Retinal Vasculopathy With Cerebral Leukoencephalopathy and Systemic ManifestationsStroke 51:300–307Google Scholar14.Nader G. P. D. F.et al.2021Compromised nuclear envelope integrity drives TREX1-dependent DNA damage and tumor cell invasionCell 184:5230–5246Google Scholar15.Verheyen E. M.2022The power of Drosophila in modeling human disease mechanismsDisease Models & Mechanisms 15:dmm049549Google Scholar16.Wolf M. J.et al.2006Drosophila as a model for the identification of genes causing adult human heart diseaseProc. Natl. Acad. Sci. U.S.A. 103:1394–1399Google Scholar17.Ugur B.Chen K.Bellen H. J.2016Drosophila tools and assays for the study of human diseasesDisease Models & Mechanisms 9:235–244Google Scholar18.Alliance of Genome Resources Consortium2024Updates to the Alliance of Genome Resources central infrastructureGenetics 227:iyae049Google Scholar19.Brown J. B.et al.2014Diversity and dynamics of the Drosophila transcriptomeNature 512:393–399Google Scholar20.Rele C. P.Sandlin K. M.Leung W.Reed L. K.2023Manual annotation of Drosophila genes: a Genomics Education Partnership protocolF1000Res 11:1579Google Scholar21.Zhao H.et al.2014CrossMap: a versatile tool for coordinate conversion between genome assembliesBioinformatics 30:1006–1007Google Scholar22.Hemphill W. O.Perrino F. W.2019Measuring TREX1 and TREX2 exonuclease activitiesMethods Enzymol 625:109–133Google Scholar23.Chen M.-J.et al.2007Cisplatin depletes TREX2 and causes Robertsonian translocations as seen in TREX2 knockout cellsCancer Res 67:9077–9083Google Scholar24.Du H.et al.2023Suppression of TREX1 deficiency-induced cellular senescence and interferonopathies by inhibition of DNA damage responseiScience 26:107090Google Scholar25.Hallgren J.et al.2022DeepTMHMM predicts alpha and beta transmembrane proteins using deep neural networkshttp://biorxiv.org/lookup/doi/10.1101/2022.04.08.48760926.Bier E.Bodmer R.2004Drosophila, an emerging model for cardiac diseaseGene 342:1–11Google Scholar27.Barrios N.Farias M.Moita M. A.2021Threat induces cardiac and metabolic changes that negatively impact survival in fliesCurrent Biology 31:5462–5472Google Scholar28.Alex A.Li A.Tanzi R. E.Zhou C.2015Optogenetic pacing in Drosophila melanogasterSci. Adv 1:e1500639Google Scholar29.Gracheva E.et al.2024Dual color optogenetic tool enables heart arrest, bradycardic, and tachycardic pacing in Drosophila melanogasterCommun Biol 7:1056Google Scholar30.Gracheva E.et al.2022Developing Drosophila melanogaster Models for Imaging and Optogenetic Control of Cardiac FunctionJoVE 63939https://doi.org/10.3791/63939Google Scholar31.Men J.et al.2020Non-invasive red-light optogenetic control of Drosophila cardiac functionCommun Biol 3:336Google Scholar32.Men J.et al.2016Drosophila Preparation and Longitudinal Imaging of Heart Function In Vivo Using Optical Coherence Microscopy (OCM)Journal of Visualized Experiments : JoVE 55002https://doi.org/10.3791/55002Google Scholar33.Dong Z.et al.2020FlyNet 2.0: drosophila heart 3D (2D + time) segmentation in optical coherence microscopy images using a convolutional long short-term memory neural networkBiomed Opt Express 11:1568Google Scholar34.Duan L.et al.2018Segmentation of Drosophila heart in optical coherence microscopy images using convolutional neural networksJournal of Biophotonics 11:e201800146Google Scholar35.Fishman M.et al.2023A Drosophila heart optical coherence microscopy dataset for automatic video segmentationSci Data 10:886Google Scholar36.Ouyang X.et al.2024An Attention LSTM U-Net model for Drosophila melanogaster heart tube segmentation in optical coherence microscopy imagesBiomed Opt Express 15:3639–3653Google Scholar37.Brand A. H.Perrimon N.1993Targeted gene expression as a means of altering cell fates and generating dominant phenotypesDevelopment 118:401–415Google Scholar38.Haaxma C. A.et al.2010A de novo p.Asp18Asn mutation in TREX1 in a patient with Aicardi–Goutières syndromeAmerican J of Med Genetics Pt A 152A:2612–2617Google Scholar39.Batut P.Dobin A.Plessy C.Carninci P.Gingeras T. R.2013High-fidelity promoter profiling reveals widespread alternative promoter usage and transposon-driven developmental gene expressionGenome Res 23:169–180Google Scholar40.Batut P. J.Gingeras T. R.2017Conserved noncoding transcription and core promoter regulatory code in early Drosophila developmenteLife 6:e29005https://doi.org/10.7554/eLife.29005Google Scholar41.Groth A. C.2004Construction of Transgenic Drosophila by Using the Site-Specific Integrase From Phage C31Genetics 166:1775–1782Google Scholar42.Nishimura M.Ocorr K.Bodmer R.Cartry J.2010Drosophila as a model to study cardiac agingExperimental gerontology 46:326Google Scholar43.Paternostro G.et al.2001Age-Associated Cardiac Dysfunction in Drosophila melanogasterCirculation Research 88:1053–1058Google Scholar44.Manjila S. B.Hasan G.2018Flight and Climbing Assay for Assessing Motor Functions in DrosophilaBio Protoc 8:e2742Google Scholar45.Brischigliaro M.Fernandez-Vizarra E.Viscomi C.2023Mitochondrial Neurodegeneration: Lessons from Drosophila melanogaster ModelsBiomolecules 13:378Google Scholar46.McGlasson S.et al.2025Misdirected yet intact TREX1 exonuclease activity causes human cerebral and systemic small vessel diseaseBrain https://doi.org/10.1093/brain/awaf085Google ScholarArticle and author informationAuthor informationElena GrachevaDepartment of Biomedical Engineering, Washington University in St Louis, St Louis, United StatesFor correspondence: gracheva@wustl.eduAbigail MattDepartment of Biomedical Engineering, Washington University in St Louis, St Louis, United StatesFei WangDepartment of Biomedical Engineering, Washington University in St Louis, St Louis, United StatesORCID iD: 0000-0002-0890-4595Raymond HsinDepartment of Biomedical Engineering, Washington University in St Louis, St Louis, United StatesHongwu LiangDepartment of Biomedical Engineering, Washington University in St Louis, St Louis, United StatesXiangping OuyangDepartment of Biomedical Engineering, Washington University in St Louis, St Louis, United StatesJimin DingDepartment of Statistics and Data Science, Division of Biostatistics, Washington University in St Louis, St Louis, United StatesJonathan J MinerDepartments of Medicine and Microbiology, RVCL Research Center, and Colton Center for Autoimmunity, University of Pennsylvania Perelman School of Medicine, Philadelphia, United StatesChao ZhouDepartment of Biomedical Engineering, Washington University in St Louis, St Louis, United StatesORCID iD: 0000-0002-8679-3413For correspondence: chaozhou@wustl.eduAuthor NotesCompeting interests: No competing interests declaredVersion historyPreprint posted: November 10, 2025Sent for peer review: November 10, 2025Reviewed Preprint version 1: March 6, 2026Cite all versionsYou can cite all versions using the DOI https://doi.org/10.7554/eLife.109595. This DOI represents all versions, and will always resolve to the latest one.Copyright© 2026, Gracheva et al.This article is distributed under the terms of the Creative Commons Attribution License, which permits unrestricted use and redistribution provided that the original author and source are credited.Metricsviews0downloads0citations0Views, downloads and citations are aggregated across all versions of this paper published by eLife.

来源:e life发布时间:2026-03-06
Cardiac neurons expressing a glucagon-like receptor mediate cardiac arrhythmia induced by high-fat diet in

Abstract Cardiac arrhythmia leads to increased risks for stroke, heart failure, and cardiac arrest. Arrhythmic pathology is often rooted in the cardiac conduction system, but the mechanism is complex and not fully understood. For example, how metabolic diseases, like obesity and diabetes, increase the risk for cardiac arrhythmia. Glucagon regulates glucose production, mobilizes lipids from the fat body, and affects cardiac rate and rhythm, attributes of a likely key player. Drosophila is an established model to study metabolic diseases and cardiac arrhythmias. Since glucagon signaling is highly conserved, we used high-fat diet (HFD)-fed flies to study its effect on heart function. HFD led to increased heartbeat and an irregular rhythm. The HFD-fed flies showed increased levels of adipokinetic hormone (Akh), the functional equivalent to human glucagon. Both genetic reduction of Akh and eliminating the Akh-producing cells (APC) rescued HFD-induced arrhythmia, whereas heart rhythm was normal in Akh receptor mutants (AkhRnull). Furthermore, we discovered a pair of cardiac neurons that express high levels of Akh receptor. These are located near the posterior heart, make synaptic connections at the heart muscle, and regulate heart rhythm. Altogether, this Akh signaling pathway provides new understanding of the regulatory mechanisms between metabolic disease and cardiac arrhythmia. Introduction Arrhythmia refers to an irregular, decreased (bradycardia), or increased (tachycardia) heartbeat. Temporary disruption is usually benign; however, chronic arrhythmia has been linked to significantly increased risks for stroke, heart failure, and cardiac arrest (Kannel et al., 1998; Kannel et al., 1983; Nattel et al., 2014; Roberts-Thomson et al., 2011). Its pathogenesis is rooted in the cardiac conduction system; however, the mechanism is complex and much remains unknown. Two well-established risk factors that directly contribute to the development of cardiovascular disorders and arrhythmia are obesity (Gupta et al., 2022; Powell-Wiley et al., 2021) and diabetes mellitus (Aune et al., 2018; Huxley et al., 2011; Lee et al., 2017). In fact, a longitudinal study into obesity (13.7 years mean follow-up; 5282 participants) found a 4% increased risk for atrial fibrillation (a form of arrhythmia) per one-unit increased body mass index (Wang et al., 2004). The other major risk factor, diabetes mellitus, has been shown to impact the cardiac conduction system, leading to increased risk of developing atrial fibrillation and ventricular arrhythmias (Kannel et al., 1998). A meta-analysis found that patients with diabetes had a 28–40% increased risk for developing atrial fibrillation, with a 20% risk increase reported for pre-diabetic patients (Aune et al., 2018; Huxley et al., 2011). The relationship between higher blood glucose levels and increased risk for atrial fibrillation was dose-responsive (Aune et al., 2018). Diabetes mellitus, when considered a cause of disrupted metabolism, as well as obesity, has been independently associated with increased risk for atrial fibrillation (Lee et al., 2017). However, to what extent diabetes, blood glucose, and obesity contribute to atrial fibrillation, independently or collectively, and through which pathomechanism requires further study. Antagonistic actions by glucagon and insulin regulate glucose metabolism. Besides regulating glucose release from the liver, glucagon facilitates the release of glucose as well as lipids from the fat body, acts as a satiety factor in the central nervous system, affects the glomerular filtration rate, and regulates intra-islet secretion of insulin, glucagon, and somatostatin to meet increased energy demands (Habegger et al., 2010; Heppner et al., 2010; Vuguin and Charron, 2011). These glucagon regulatory effects are evident in patient studies that showed that an impaired counter-regulatory glucagon response, observed as increased free plasma insulin levels, contributes to glucose instability in patients with long-term diabetes Scott et al., 1980; that consumption of dietary fats leads to increased plasma glucagon levels in healthy volunteers Radulescu et al., 2010; and that plasma glucagon levels were significantly higher in people considered obese compared to those considered lean (Stern et al., 2019). Glucagon has been repeatedly shown to affect heart contraction and heart rate. However, the nature of this effect is complex; whether glucagon acts anti- or pro-arrhythmogenic seems to depend on context, such as a non-failing heart or a heart at acute or chronic failure (Neumann et al., 2023). That said, glucagon-producing tumors, that is, glucagonomas, can cause tachycardia (a form of arrhythmia defined as >100 heart beats per minute) and heart failure without secondary cause (Chang-Chretien et al., 2004; Zhang et al., 2014). Moreover, glucagonoma tumor resection resulted in a normalized heart rate and a return to typical heart size and function (Chang-Chretien et al., 2004). Similarly, glucagon infusion in healthy human volunteers induced arrhythmias (Jaca et al., 2002; Markiewicz et al., 1978). Thus, while glucagon clearly affects heart rhythm, when considering the underlying mechanism, much remains unknown. The link between high-fat diet (HFD), glucagon, and cardiac arrhythmia is conserved and well-established in animal models. In fact, studies from the 1960s already showed that glucagon increases heart rate in a variety of mammalian species, including dogs, cats, guinea pigs, and rats (Farah and Tuttle, 1960; Lucchesi et al., 1968). More recently, it was shown in mice that both glucagon and the glucagon receptor (Gcgr) are involved in heart rate regulation (Mukharji et al., 2013; Sowden et al., 2007). Drosophila adipokinetic hormone (Akh), the functional equivalent to human glucagon, is expressed in a small cluster of endocrine neurons, Akh-producing cells (APC) (Kim and Rulifson, 2004; Lee and Park, 2004). These cells in the corpora cardiaca near the esophagus function similarly to islet cells in mammals, including the mechanism that regulates hormone secretion, and are essential for larval glucose homeostasis (Kim and Rulifson, 2004). Like glucagon, Akh is known to also mobilize lipids from the fat body to regulate glucose levels, in the form of trehalose, in the circulating hemolymph to accommodate increased energy demand (Isabel et al., 2005). Likewise, increased Akh increases the heart rate in flies (Noyes et al., 1995). These studies together suggest that glucagon and glucagon signaling, aside from regulating blood sugar levels, play an evolutionarily conserved role in heart rate regulation. Drosophila melanogaster is a well-established model to study heartbeat and heart arrhythmia (Birse et al., 2010; Ding et al., 2022; Ocorr et al., 2007). For example, HFD-fed flies were used to study the genetic mechanisms of cardiac dysfunction in obesity. It found that HFD leads to reduced cardiac contractility and a reduced heart period (Birse et al., 2010). Notably, this phenotype was attenuated by intervention at the insulin-TOR signaling pathway (Birse et al., 2010), thus supporting a connection between obesity, glucagon, insulin, and cardiac function. Here, we used Drosophila fed a HFD to study heart arrhythmia. HFD led to increased Akh in the APC of the corpora cardiaca. We then identified a hitherto undescribed pair of cardiac neurons near the posterior heart that highly express the Akh receptor (AkhR) and directly innervate the fly heart. We show that these AkhR cardiac neurons (ACN) regulate heart rhythm in the flies and mediate the HFD-induced arrhythmia. Given the conservation of Akh/glucagon signaling, these findings likely have implications for arrhythmia in patients. Given the significance of the vagus nerve in cardiac rhythm (Ambache and Lippold, 1949; Cai et al., 2023; Freeman, 1951; González et al., 2023; Kharbanda et al., 2023; van Weperen and Vaseghi, 2023), it could fulfill a similar function. Results High-fat diet increases heart rate and arrhythmia index All flies (w1118) that eclosed (i.e., adults that emerged from pupa) within 8 hours were sorted (females only) and transferred to fresh food vials (25 flies per vial) containing normal fat diet (NFD) or HFD (NutriFly diet supplemented with 14% fat) for 7 days. At which point, we determined the heartbeat of the flies using optical coherence tomography (OCT) (Figure 1A). Flies on a HFD show a significantly reduced heart period and increased arrhythmia index compared to NFD-fed flies (Figure 1B–D). These findings are in agreement with previous work (Birse et al., 2010) and indicate that HFD imposes a pathogenic effect on heart function. Figure 1 Download asset Open asset High-fat diet (HFD) increases heart rate and arrhythmia index in Drosophila. (A) Schematic illustration of the experimental design. Adult flies (female) were fed either a normal fat diet (NFD) or an HFD for 7 days following eclosion from pupa, then subjected to heart functional analysis using optical coherence tomography (OCT) to determine the heart period and the arrhythmia index. (B) Representative images obtained from OCT videos of w1118 flies that were fed NFD or HFD as indicated. Scale bars: 2 seconds. (C, D) Quantitation of heart period (C; n=15 NFD, n=11 HFD) and arrhythmia index (D; n=14 NFD, n=12 HFD). Statistical analysis was performed using t-test corrected with Welch; **p<0.01. The numerical data used to generate the figure are provided in Figure 1—source data 1. Figure 1—source data 1 The numerical data used to generate the Figure 1. https://cdn.elifesciences.org/articles/94512/elife-94512-fig1-data1-v1.xlsx Download elife-94512-fig1-data1-v1.xlsx High-fat diet up-regulates Akh expression and increases Akh-producing cell (APC) activity The ingestion of superfluous macronutrients has a great impact on renal function, feeding behavior, and metabolism (Huang et al., 2020; Liao et al., 2021; Zhao et al., 2025; Zhao et al., 2023; Zhao et al., 2022). We observed enlarged crops, the functional equivalent to the human stomach, in the HFD-fed flies (Figure 2—figure supplement 1). We asked whether the metabolic signaling pathways contributed to the HFD-caused pathogenic effect on the heart. Akh, the functional equivalent to human glucagon, is expressed by a group of neuroendocrine cells known as APC in the corpora cardiaca (Lee and Park, 2004). Indeed, flies that carried Akh-Gal4 to express GFP showed Akh-producing cells at the corpora cardiaca, which attaches to the esophagus, just anterior to the proventriculus (Figure 2A). Inconsistent with a previous work (Liao et al., 2021), we showed that the expression of Akh was significantly up-regulated in the flies fed a HFD, compared to NFD-fed flies (Figure 2B). Figure 2 with 1 supplement see all Download asset Open asset High-fat diet (HFD) upregulates adipokinetic hormone gene Akh and activates Akh neurons. (A) Representative confocal image of Akh-producing cells (APCs; green, GFP) in Akh-Gal4>10xUAS-GFP (Akh-Gal4>GFP) transgenic flies (3-day-old females). The image shows the anterior section of the digestive system, including the crop, esophagus, and proventriculus. The APCs are located at the corpora cardiaca, which attaches to the esophagus, just anterior to the proventriculus. Phalloidin stains actin filaments red; DAPI stains DNA in nucleus blue. Scale bar: 100 μm. (B) RT-qPCR analysis of Akh expression in w1118 flies (female) that were fed either a normal fat diet (NFD) or a high-fat diet (HFD) for 7 days following eclosion from pupa. Ten flies per group, repeated three times. Statistical analysis was performed with unpaired t-test corrected with Welch; *p<0.05. Error bars represent SD. (C) Representative confocal images of Akh-Gal4>CaLexA APCs from female adult flies fed an NFD or HFD (for 7 days following eclosion from pupa). CaLexA is a transcription-based genetically encoded calcium indicator for neuronal activity. CaLexA fluorescence has been presented as a heatmap; scale from 0 (blue), no CaLexA detected, to 255 (red) high levels CaLexA. Scale bar: 20 μm. (D) Quantitation of CaLexA fluorescence in C (7-day-old females; NFD, n=14; HFD, n=10). Statistical analysis was performed with unpaired t-test corrected with Welch; ***p<0.001. (E) Representative confocal images of w1118 APCs from female adult flies fed an NFD or HFD (for 7 days following eclosion from pupa). Anti-Akh is in red. DAPI stains DNA in blue. Scale bar: 20 μm. (F) Quantitation of anti-Akh fluorescence in E (7-day-old females; NFD, n=8; HFD, n=7). Statistical analysis was performed with unpaired t-test corrected with Welch; **p<0.01. The numerical data used to generate the figure are provided in Figure 2—source data 1. Figure 2—source data 1 The numerical data used to generate the Figure 2. https://cdn.elifesciences.org/articles/94512/elife-94512-fig2-data1-v1.xlsx Download elife-94512-fig2-data1-v1.xlsx Next, to test whether HFD affects APC neuron activity, we used CaLexA (Masuyama et al., 2012). A basal level of CaLexA fluorescence was observed in the APC of NFD-fed flies, while a significantly higher fluorescence was detected in the APC of HFD-fed flies (Figure 2C and D). This shows that HFD increases APC neuron activity. Taken together, our data show that HFD activates Akh expression in the APC and increases APC activity. Akh regulates heartbeat To confirm the importance of APC activity and Akh release by the APC, we downregulated Akh (Akh-Gal4>UAS-Akh-RNAi) and analyzed its effect on heart function. Immunostaining showed diminished anti-Akh (Lee and Park, 2004) fluorescence (Figure 3—figure supplement 1), indicating the RNAi efficiency. As expected, upon Akh depletion in the APCs, the difference in arrhythmia between the NFD and HFD-fed flies disappeared (Figure 3A and B). The findings indicate that the endocrine signal Akh, originating in the APC neurons, mediates the HFD cardiac functional pathogenicity. Figure 3 with 1 supplement see all Download asset Open asset Akh regulates the heartbeat. (A) Representative images obtained from optical coherence tomography (OCT) videos of control (Akh-Gal4) and Akh-RNAi (Akh-Gal4>UAS-Akh-RNAi) flies (females, 7 days old) that were fed a normal fat diet (NFD) or a high-fat diet (HFD), as indicated, for seven days starting at eclosion from pupa. Scale bars: 2 seconds. (B) Quantitation of the arrhythmia index in control (n=15 NFD, n=13 HFD) and Akh-RNAi (n=13 NFD, n=14 HFD) flies. Statistical analysis was performed with two-way ANOVA corrected with Sidak. Statistical significance: *p<0.05; ****p<0.0001; ns, not significant. The numerical data used to generate the figure are provided in Figure 3—source data 1. Figure 3—source data 1 The numerical data used to generate the Figure 3. https://cdn.elifesciences.org/articles/94512/elife-94512-fig3-data1-v1.xlsx Download elife-94512-fig3-data1-v1.xlsx AkhR mediates the high-fat diet pathogenic effect on the heartbeat Akh binds its receptor AkhR, a G-protein coupled receptor, to activate the signaling pathway (Staubli et al., 2002). We quantified AkhR expression using RT-qPCR and observed significantly up-regulated expression in HFD-fed flies (Figure 4A). To confirm its role in Akh-mediated HFD-induced arrhythmia, we tested AkhR null mutant flies (AkhRnull). In line with Akh depletion, flies with AkhR mutation and fed a HFD did not show the HFD-associated cardiac arrhythmia (Figure 4B and C). These data show that Akh/AkhR signaling mediates the pathogenic effect of HFD on heart function. Figure 4 Download asset Open asset AkhR regulates the heartbeat. (A) RT-qPCR analysis of AkhR expression in w1118 flies (female) that were fed either a normal fat diet (NFD) or a high-fat diet (HFD) for 7 days following eclosion from pupa. Ten flies per group, repeated three times. Statistical analysis was performed with unpaired t-test corrected with Welch; *p<0.05. Error bars represent SD. (B) Quantitation of arrhythmia index in control (n=14 NFD, n=12 HFD) and AkhRnull (n=13 NFD, n=11 HFD) flies. Statistical analyses were performed with two-way ANOVA corrected with Sidak; **p<0.01; ***p<0.001; ns, not significant. (C) Representative images obtained from optical coherence tomography (OCT) videos of control (w1118) and AkhRnull mutant flies (females, 7 days old) that were fed NFD or HFD, as indicated, for seven days starting at eclosion from pupa. Scale bars: 2 seconds. The numerical data used to generate the figure are provided in Figure 4—source data 1. Figure 4—source data 1 The numerical data used to generate the Figure 4. https://cdn.elifesciences.org/articles/94512/elife-94512-fig4-data1-v1.xlsx Download elife-94512-fig4-data1-v1.xlsx A pair of AkhR cardiac neurons (ACN) are associated with the heart To determine the AkhR expression pattern, we used AkhR-Gal4 (Lee et al., 2018) to drive the expression of GFP. The adipose fat body tissue is a major organ that expresses AkhR at the embryonic and larval stages (Grönke et al., 2007), as well as in the adult (Bharucha et al., 2008). Likewise, we observed GFP fluorescence in the fat body in AkhR-Gal4>GFP flies (Figure 5A and B). Notably, no fluorescence was detected in the cardiac muscles. However, we did find two neurons with strong GFP fluorescence, indicative of high expression levels of AkhR, located near the posterior end of the heart tube (Figure 5B). These neurons had elaborate neurites along the heart tube (Figure 5B–D) and formed synaptic connections with heart muscles, as revealed by immunostaining for active zone marker Bruchpilot (Brp) (Figure 5E and F). These two neurons likely communicate with the heart muscle via these neuromuscular junctions. Therefore, we refer to these two neurons as AkhR cardiac neurons (ACN). Immunostaining for Akh showed positive fluorescence on the ACN (Figure 5—figure supplement 1), suggesting that the cardiac neurons receive Akh signal. Figure 5 with 1 supplement see all Download asset Open asset AkhR cardiac neurons (ACNs) form synaptic connections with the posterior heart. (A) Graphic depiction of the body (no legs or wings) of an adult fly with the head oriented toward the top. The heart tube (red) is located along the midline in the abdomen (bottom of graphic), with the alary muscles that connect the heart to the exoskeleton represented in light gray. (B) A representative confocal image of an AkhR-Gal4>10xUAS-GFP adult fly (7-day-old, female). The dorsal region of an abdomen corresponding to the boxed region in (A) is shown. AkhR >GFP labels AkhR in green. ACN, AkhR cardiac neuron. Phalloidin stains actin filaments red. Scale bar: 100 μm. (C) Schematic illustration of the posterior fly heart. Corresponds to boxed region in (A). (D) A representative confocal image of the posterior heart of an AkhR-Gal4>10xUAS-GFP fly (7-day-old, female) corresponding to the boxed region in (C). AkhR>GFP labels AkhR in green. Phalloidin stains actin filaments red. Scale bar: 50 μm. (E) Schematic illustration of the posterior end of an adult fly heart. The neurites of the cardiac neurons are depicted in green. Relates to the boxed region in (C). (F) Confocal image of the posterior heart of an AkhR-Gal4>10xUAS-GFP fly (7-day-old, female) corresponding to the boxed region in (E). AkhR>GFP labels AkhR in green. Anti-Bruchpilot (Brp), a marker for the active zone, is shown in magenta. Scale bar: 10 μm. Partial elimination of AkhR cardiac neurons (ACN) causes arrhythmia To determine the function of the ACN, we set out to eliminate the pair. We overexpressed UAS-rpr under the control of AkhR-Gal4 to induce apoptosis. We observed one remaining AkhR cardiac neuron in the AkhR-Gal4>UAS rpr flies (Figure 6A), indicating partial elimination. The AkhR-Gal4>UAS rpr flies were subjected to OCT analysis. The profile and rhythm of the heartbeat were drastically affected in the flies with only one ACN (Figure 6B). This demonstrates the importance of the ACN in regulating the heartbeat. Figure 6 Download asset Open asset Partial elimination of ACNs causes arrhythmia. (A) A representative confocal image of an adult AkhR-Gal4>rpr, GFP (AkhR-Gal4>UAS-rpr, UAS-GFP) fly (7-day-old, female). AkhR >GFP labels AkhR in green. AkhR, adipokinetic hormone receptor; rpr, reaper. Phalloidin stains actin filaments red. Scale bar: 100 μm. (B) Representative images obtained from optical coherence tomography (OCT) videos of control (w1118) and AkhR-Gal4>rpr (AkhR-Gal4>UAS-rpr, UAS-GFP) flies (7-day-old, female). Scale bar: 2 seconds. (B) Quantitation of arrhythmia index in control (n=14 NFD) and AkhR-Gal4>rpr (n=23 NFD). Statistical analysis was performed using t-test corrected with Welch; ****p<0.0001. The numerical data used to generate the figure are provided in Figure 6—source data 1. Figure 6—source data 1 The numerical data used to generate the Figure 6. https://cdn.elifesciences.org/articles/94512/elife-94512-fig6-data1-v1.xlsx Download elife-94512-fig6-data1-v1.xlsx Discussion The role of AkhR, glucagon-like receptor, in regulating heart rate and rhythm Heart function is dependent on ATP continuous synthesis. Cardiac ATP comes from fatty acids, glucose, and lactate (Kodde et al., 2007). Glucagon converts stored glycogen, in the liver and fat tissue, into glucose that is released into the blood stream. Its link to cardiac arrhythmia has been well-established. The glucose signaling pathway is conserved across species, including Drosophila (Kim and Rulifson, 2004). Like in humans, in flies, the glucagon-like hormone Akh regulates the glucose levels in hemolymph (fly equivalent to blood) (Kim and Rulifson, 2004). Under starvation conditions, Akh mobilizes glycogen and lipids to maintain the circulatory glucose levels. The flies become hyperactive and show increased food searching behavior. Flies without Akh, either by depletion or APC elimination, show starvation-resistant behavior, suggesting that the behavioral change is mediated by Akh (Huang et al., 2020; Lee and Park, 2004; Yu et al., 2016). Notably, in flies fed a HFD, the AkhR-expressing neurons in the brain become hypersensitive to Akh stimulation, due to upregulated AkhR (Huang et al., 2020). Finally, prepupae injected with low pharmacological doses of Akh, that is, doses higher than physiologically expected, showed increased heart rates (Noyes et al., 1995). Thus, in both humans and flies, heart rate and rhythm respond to nutritional changes (flies, see Figure 1), this mechanism likely supports the higher metabolic demands and possibly mediates the switch from glucose to stored lipids as the main energy source. To date, studies have focused on the direct effect of glucagon on cardiac tissue, based on the notion that cardiomyocytes express glucagon receptors (GCGR). However, evidence of GCGR expression in human heart tissue has been conflicting. No cardiac signal was detected when using radioactively labeled glucagon (Bomholt et al., 2022), results of mRNA data have been inconsistent (Aranda-Domene et al., 2023; Bomholt et al., 2022), and protein data for GCGR to support cardiac expression is lacking (Neumann et al., 2023). Here, we identified an endocrine neuron-heart axis using a fly model for HFD-induced arrhythmia. In this fly model (Figure 7), the consumption of a HFD elevates the expression of Akh, a glucagon-like hormone, and activity of the APC. The elevated circulatory Akh is transported to the AkhR cardiac neurons (ACN) located near the posterior end of the heart, where the increased signaling leads to an escalated heart arrhythmia index. It is noteworthy that Akh injection induces cardioacceleration in prepupae (Noyes et al., 1995). These findings revealed a hitherto undescribed regulatory signaling pathway that links the consumption of superfluous macronutrients with heart arrhythmia. Figure 7 Download asset Open asset Model: Akh/AkhR mediates the high-fat diet (HFD)-induced cardiac arrhythmia. An HFD upregulates adipokinetic hormone (Akh) levels in the Akh-producing cells (APCs) located at the corpora cardiaca adjacent to the anterior esophagus. HFD also increases APC activity; this results in increased Akh secretion into the circulation. Akh acts on the Akh receptors (AkhR) expressed by the AkhR cardiac neurons (ACN). The ACN are a pair of neurons located at the posterior end of the adult fly heart that regulate the heartbeat. Through these signaling pathways, increased Akh under HFD conditions leads to increased arrhythmia. Cardiac regulatory neurons in Drosophila Drosophila have a cardiac cycle that consists of alternating retrograde and anterograde heartbeats that correlate to the multi-chamber diastole and systole, respectively (Dulcis and Levine, 2005a). Accordingly, two signaling systems that innervate the fly heart were identified. The retrograde beat is being regulated by glutamatergic innervation. Its transverse nerves run bilaterally along the longitudinal muscle and innervate the cardiac muscles of the conical chamber as well as the alary muscles (Dulcis and Levine, 2005a; Dulcis and Levine, 2003). The anterograde heartbeat is being regulated by crustacean cardioactive peptide (CCAP) innervation. Its bipolar neurons (BpN) extend CCAP fibers that innervate each segment of the abdominal heart. Four additional large CCAP-positive neurons innervate the terminal chamber (Dulcis et al., 2005b; Dulcis and Levine, 2003). These earlier studies leave the possibility of synaptic input or hormonal regulation of the BpN neurosecretory signals to the heart. The authors comment on the absence of direct descending input from the corpora cardiaca to the Drosophila abdominal heart as has been observed in other systems (Dulcis and Levine, 2003). Here, we identified corpora cardiaca released Akh signaling to previously unreported AkhR cardiac neurons (ACN) that could exercise this function in flies. Given their localization at the terminal end of the cardiac chamber, where the four large CCAP-positive neurons are located as well, it is possible that the ACN modulate CCAP signaling at the heart. In fact, the previous study detected synaptotagmin on the BpN (BpN6) cell bodies, which suggests the presence of presynaptic sites (Dulcis and Levine, 2003). We are currently investigating if the BpN and ACN act together, whether in concert or opposingly. Relevance of findings in flies for humans This study revealed how glucagon-like hormone Akh is released by APCs in response to HFD and stimulates AkhR cardiac neurons (ACNs) to regulate heart rhythm in flies. Like in the flies, glucagon infusion in healthy human volunteers induces arrhythmias (Jaca et al., 2002; Markiewicz et al., 1978). Moreover, a preliminary study in infants and children demonstrated the potential of glucagon to treat atrioventricular (AV) block, a heart rhythm disorder marked by a slow heart rate caused by dysfunctional electrical conduction (Hurwitz, 1973). Clinical guidelines by the American Heart Association recommend the use of glucagon to treat bradycardia due to beta-blocker or calcium channel blocker overdose (Kusumoto et al., 2019). However, the mechanism by which glucagon exerts these beneficial clinical effects remains poorly understood. Our findings implicate a potentially conserved signaling pathway in which elevated glucagon leads to increased cardiac neuronal activity and subsequent increased heart rate and arrhythmia. Multiple trials are investigating the possible benefits of glucagon receptors (GCGR) agonists alone or in combination with GLP-1 agonists to treat arrhythmia, but so far the results have been mixed. An initial trial with a GCGR antagonist in patients with type 2 diabetes was halted prematurely due to the detrimental side effects, which included elevated blood cholesterol and steatosis (liver dysfunction) (Agrawal and Gupta, 2016; Kazda et al., 2016; Pearson et al., 2016). Our findings provide new possible glucagon-related targets for treating obesity-associated cardiac arrhythmia by targeting cardiac neurons receptive to glucagon signaling rather than the cardiomyocytes, as had been the leading hypothesis to date. Studies into the human equivalent of ACN would be interesting; possibly, the vagus nerve could fulfill a similar function as its importance for cardiac rhythm has been firmly established (Ambache and Lippold, 1949; Cai et al., 2023; Freeman, 1951; González et al., 2023; Kharbanda et al., 2023; van Weperen and Vaseghi, 2023). Finally, while the exact implications of these findings for new therapeutics remain to be seen, they do support the avoidance of a HFD. If unavoidable, for example, in the case of a therapeutic ketogenic diet or in the subset of patients with diabetes who have elevated glucagon blood levels (D’Alessio, 2011; Unger et al., 1970), then targeting the glucagon pathway might protect against harmful cardiac side effects. Materials and methods Key resources table Reagent type (species) or resourceDesignationSource or referenceIdentifiersAdditional informationAntibodyMouse monoclonal anti-BrpDevelopmental Studies Hybridoma BankCat# Nc82RRID:AB_2314866IF (1:100)AntibodyGoat polyclonal anti-mouse Alexa Fluor 647Jackson Immunoresearch LaboratoriesCat# 115-605-003RRID:AB_2338902IF (1:500)AntibodyRabbit polyclonal anti-AkhProf. Jae ParkN.A.IF (1:1000)AntibodyGoat polyclonal anti-rabbit Alexa Fluor 568Thermo FisherCat# A-11011RRID:AB_143157IF (1:500)OtherAlexa Fluor 647 PhalloidinThermo FisherCat# A22287IF (1:1000)OtherNormal goat serumJackson Immunoresearch LaboratoriesCat# 102643-5941% in 1xPBSTGenetic reagent (Drosophila melanogaster)w1118Bloomington Drosophila Stock CenterRRID:BDSC_3605Genetic reagent (D. melanogaster)Akh-Gal4Bloomington Drosophila Stock CenterRRID:BDSC_25684Genetic reagent (D. melanogaster)UAS-Akh-RNAiBloomington Drosophila Stock CenterRRID:BDSC_34960Genetic reagent (D. melanogaster)w1118 P{UAS-rpr.C}27; P{UAS-2xEGFP}AH3Bloomington Drosophila Stock CenterRRID:BDSC_ 91417Genetic reagent (D. melanogaster)AkhRnullBloomington Drosophila Stock CenterRRID:BDSC_80937Genetic reagent (D. melanogaster)w[*]; P{w[+mC]=LexAop-CD8-GFP-2A-CD8-GFP}2; P{w[+mC]=UAS-mLexA-VP16-NFAT}H2, P{w[+mC]=lexAop-rCD2-GFP}3/TM6B, Tb[1]Bloomington Drosophila Stock CenterRRID:BDSC_66542Genetic reagent (D. melanogaster)10xUAS-GFPBloomington Drosophila Stock CenterRRID:BDSC_32185Genetic reagent (D. melanogaster)AkhR-T2A-Gal4Bloomington Drosophila Stock CenterRRID:BDSC_78877Chemical compound, drug4% paraformaldehyde (PFA)Thermo Fisher ScientificCat# J19943.K2Chemical compound, drugTriton X-100Sigma-AldrichCat# 9002-93-10.2% in 1xPBSChemical compound, drug4′,6-Diamidino-2-phenylindole (DAPI)Thermo Fisher ScientificCat# D1306RRID:AB_2629482(0.5 µg/ml)Commercial assay or kit10x phosphate buffered salineQuality BiologicalCat# 119-069-131Commercial assay or kitTRIzolThermo Fisher ScientificCat# 15596026Commercial assay or kitEcoDry Premix kitTakara BioCat# 639549Commercial assay or kitPowerSYBR GreenApplied Biosystems, Thermo Fisher ScientificCat# 4367659Commercial assay or kitVECTASHIELDVector LaboratoriesCat# H-1000Software, algorithmAdobe Illustrator 2022Adobe Inc.RRID:SCR_010279Software, algorithmImageJNational Institutes of HealthRRID:SCR_003070Software, algorithmGraphPad Prism9GraphPadRRID:SCR_002798 Drosophila husbandry Request a detailed protocol Drosophila were reared on a NFD (Nutri-Fly German formula; Genesee Scientific, San Diego, CA; 66-115) or a HFD (NFD supplemented with 14% coconut oil), under standard conditions (25°C, 60% humid, 12 hour:12 hour dark:light). The following fly lines were obtained from Bloomington Drosophila Stock Center (BDSC) at Indiana University Bloomington (Bloomington, IN): w1118 (BDSC_3605), Akh-Gal4 (BDSC_25684), UAS-Akh-RNAi (BDSC_34960), Akh-T2A-Gal4 (BDSC_78877), w1118 P{UAS-rpr.C}27; P{UAS-2xEGFP}AH3 (BDSC_91417), AkhRnull (BDSC_80937), w[*]; P{w[+mC]=LexAop-CD8-GFP-2A-CD8-GFP}2; P{w[+mC]=UAS-mLexA-VP16-NFAT}H2, P{w[+mC]=lexAop-rCD2-GFP}3/TM6B, Tb[1] (BDSC_66542), and 10xUAS-GFP (BDSC_32185). Optical coherence tomography (OCT) Request a detailed protocol Cardiac function in adult Drosophila was measured using an OCT system (Bioptigen; this system was built by the Biophotonics Group, Duke University, Durham, NC; Yelbuz et al., 2002). For this, newly eclosed adult flies (female) were transferred to fresh vials containing NFD or HFD for 7 days. The flies were anesthetized by carbon dioxide (CO2) and mounted onto a glass slide using fixogum rubber cement (Marabu GmbH & Co. KG, Tamm, Germany; MR290117000). The flies were allowed to recover for 10 minutes and then imaged using OCT. The flies were scanned at the cardiac chamber in abdominal segment A2. The acquisition parameters were as follows: 48 Hz, 800 frames. Quantification of heart period and arrhythmia index Request a detailed protocol The heart period and arrhythmia index were quantified as previously reported (Ocorr et al., 2007) with minor modifications. In brief, the OCT raw data was processed using ImageJ software (version 2.9.0/1.53) (Schneider et al., 2012). Within each OCT image (10 seconds), the heart periods were arranged by length. The heart period value for each fly was based on the average of three short, three medium, and three long heart periods (i.e., nine periods in total). The arrhythmia index for a genotype was based on the group average (7-day-old females; n=11–23), presented with the standard deviation (SD). Immunostaining and confocal imaging Request a detailed protocol Flies were dissected in 1xPBS, then fixed in 4% PFA for 30 minutes at room temperature. The specimens were then washed in PBST (0.2% Triton X-100 in 1xPBS) three times, 15 minutes each, followed by blocking in 1% normal goat serum (Jackson ImmunoResearch Laboratories, West Grove, PA; 102643–594) in PBST for 1 hour at room temperature. The specimens were incubated in primary antibody at 4°C overnight, then washed in PBST three times for 15 minutes. Next, the specimens were incubated in secondary antibody for 2 hours at room temperature, followed by three 15-minute washes in PBST, followed by a 10-minute wash in PBS. DAPI staining (Thermo Fisher Scientific, Waltham, MA; D1306, 0.5 μg/ml in PBST) was performed in-between the washing steps after the secondary antibody staining. The following antibodies were used: mouse monoclonal anti-Brp 1:100 (Developmental Studies Hybridoma Bank, Iowa City, IA; nc82, RRID:AB_2314866); rabbit anti-Akh (1:1000); goat anti-rabbit Alexa Fluor 568 1:500 (Thermo Fisher; A-11011); goat anti-mouse Alexa Fluor 647 1:500 (Jackson ImmunoResearch Laboratories; 115-605-003). Alexa Fluor 647 Phalloidin 1:1000 (Thermo Fisher Scientific; A22287) was used to stain the filament actin. Antibodies were diluted in the blocking buffer. The specimens were mounted with Vectashield antifade mounting media (Vector Laboratories, Newark, CA; H-1000). The samples were imaged using a ZEISS LSM 900 confocal microscope and ZEISS ZEN blue edition (version 3.0) acquisition software under a 20× Plan-Apochromat 0.8 N.A. air objective or a 63× Plan-Apochromat 1.4 N.A. oil objective. For quantitative comparison of intensities, settings were chosen to avoid oversaturation (using range indicator in ZEN blue) and applied across images for all samples within an assay. ImageJ was used for image processing (version 2.9.0/1.53t; National Institutes of Health, Bethesda, MD) (Schneider et al., 2012). Reverse transcriptase-quantitative PCR (RT-qPCR) Request a detailed protocol For quantification of Akh and AkhR mRNA levels, adult female flies fed NFD or HFD for 7 days were transferred into 1.5 ml Eppendorf tubes (10 flies/tube) and flash frozen in liquid nitrogen. Total RNA was extracted using TRIzol (Thermo Fisher Scientific, Cat# 15596026) according to the manufacturer’s protocol. In brief, 0.5 ml TRIzol was added to each tube, then flies were grinded using a pestle. Following, 0.1 ml chloroform was added, sample tubes securely capped, and vigorously shaken by hand for 15 seconds. Samples were incubated at 22°C for 2 minutes, then centrifuged at 12,000 × g for 15 minutes at 4°C, and supernatants transferred to a clean tube in which total RNA was precipitated using isopropanol (Sigma-Aldrich, St. Louis, MO; 67-63-0). Synthesis of cDNA using reverse transcriptase was performed with the RNA to cDNA EcoDry Premix kit (Takara Bio, San Jose, CA; 639549) and the subsequent quantitative PCR using PowerSYBR Green (Applied Biosystems, Thermo Fisher Scientific; 4367659), according to the manufacturers’ protocols. qPCR was performed using a QuantStudio 6 Pro Real-Time PCR machine (Thermo Fisher Scientific). The following primers (5’–3’) were used: Akh_F TTTCGAGACACAGCAGGGCA, with Akh_R GGTGCTTGCAGTCCAGAAA; AkhR_F ACAATCCGTCGGTGAACA, with AkhR_R CATCACCTGGCCTCTTCCAT. For each treatment, three biological replicates were prepared. ΔΔCT method was used to quantify the gene expression levels with normalization to Ribosomal protein L32 (RpL32) as internal reference gene (Rpl32_F AACCGCGTTTACTGCGGCGA, with Rpl32_R AGAACGCAGGCGACCGTTGG). CaLexA assays Request a detailed protocol CaLexA assays were performed to determine the neuron activity. Akh-Gal4 virgins were crossed with CaLexA males (w[*]; P{w[+mC]=LexAop-CD8-GFP-2A-CD8-GFP}2; P{w[+mC]=UAS-mLexA-VP16-NFAT}H2, P{w[+mC]=lexAop-rCD2-GFP}3/TM6B, Tb[1]) and maintained on NFD. The newly eclosed adults were transferred to fresh food vials containing NFD or HFD for 3 days. The flies were then dissected in 1x phosphate buffered saline (1xPBS) (Quality Biological, Gaithersburg, MD; 119-069-131) at room temperature and fixed in 4% paraformaldehyde (PFA) (Thermo Fisher Scientific; J19943.K2) in 1xPBS for 1 hour at room temperature, followed by three 15-minute washes in 1xPBS with Triton X-100 (Sigma-Aldrich; 9002-93-1) (PBST). The specimens were then stained in DAPI (0.5 μg/ml in PBST) (Thermo Fisher Scientific; D1306) for 10 minutes and washed once for 15 minutes in 1xPBS before mounting with Vectashield antifade mounting media (Vector Laboratories; H-1000). The samples were imaged using a ZEISS LSM 900 confocal microscope and ZEISS ZEN blue edition (version 3.0) acquisition software under a 20× Plan-Apochromat 0.8 N.A. air objective and a 63× Plan-Apochromat 1.4 N.A. oil objective. For quantitative comparison of intensities, settings were chosen to avoid oversaturation (using range indicator in ZEN blue) and applied across images for all samples within an assay. ImageJ was used for image processing (version 2.9.0/1.53t; National Institutes of Health) (Schneider et al., 2012). Data analysis and figure preparation Request a detailed protocol Figures were arranged using Adobe Illustrator software (version 26.2.1; Adobe Inc, San Jose, CA). The relative fluorescence intensity was acquired using ImageJ software (version 2.9.0/1.53t; National Institutes of Health) (Schneider et al., 2012). Data plotting and statistical analyses were performed using Prism 9 (GraphPad Software, Boston, MA). For box plots, midlines represent the median, and whiskers indicate the minimum and maximum values. Data normality was tested by using the Shapiro–Wilk test. Normally distributed data were analyzed by Student’s t-test with Welch’s correction (two groups) or by a one-way ANOVA followed by Dunnett’s correction or two-way ANOVA corrected with Sidak. p-value <0.05 was considered significant. Add a comment + Open annotations. The current annotation count on this page is being calculated. Data availability All relevant data can be found within the article and its supplementary information. References Agrawal S Gupta Y (2016) Comment on kazda et al evaluation of efficacy and safety of the glucagon receptor antagonist LY2409021 in patients with type 2 diabetes: 12- and 24-week phase 2 studies diabetes care 2016;39:1241-1249 Diabetes Care 39:1241–1249. https://doi.org/10.2337/dc16-1340 PubMed Google Scholar Ambache N Lippold OC (1949) Bradycardia of central origin produced by injections of tetanus toxin into the vagus nerve The Journal of Physiology 108:186–196. https://doi.org/10.1113/jphysiol.1949.sp004322 PubMed Google Scholar Aranda-Domene R Orenes-Piñero E Arribas-Leal JM Canovas-Lopez S Hernández-Cascales J (2023) Evidence for a lack of inotropic and chronotropic effects of glucagon and glucagon receptors in the human heart Cardiovascular Diabetology 22:128. https://doi.org/10.1186/s12933-023-01859-8 PubMed Google Scholar Aune D Feng T Schlesinger S Janszky I Norat T Riboli E (2018) Diabetes mellitus, blood glucose and the risk of atrial fibrillation: a systematic review and meta-analysis of cohort studies Journal of Diabetes and Its Complications 32:501–511. https://doi.org/10.1016/j.jdiacomp.2018.02.004 PubMed Google Scholar Bharucha KN Tarr P Zipursky SL (2008) A glucagon-like endocrine pathway in Drosophila modulates both lipid and carbohydrate homeostasis The Journal of Experimental Biology 211:3103–3110. https://doi.org/10.1242/jeb.016451 PubMed Google Scholar Birse RT Choi J Reardon K Rodriguez J Graham S Diop S Ocorr K Bodmer R Oldham S (2010) High-fat-diet-induced obesity and heart dysfunction are regulated by the TOR pathway in Drosophila Cell Metabolism 12:533–544. https://doi.org/10.1016/j.cmet.2010.09.014 PubMed Google Scholar Bomholt AB Johansen CD Christensen JB Kjeldsen SAS Galsgaard KD Winther-Sørensen M Serizawa R Hornum M Porrini E Pedersen J Ørskov C Gluud LL Sørensen CM Holst JJ Albrechtsen R Wewer Albrechtsen NJ (2022) Evaluation of commercially available glucagon receptor antibodies and glucagon receptor expression Communications Biology 5:1278. https://doi.org/10.1038/s42003-022-04242-7 PubMed Google Scholar Cai C Wu N Yang G Yang S Liu W Chen M Po SS investigators TP (2023) Transcutaneous electrical vagus nerve stimulation to suppress premature ventricular complexes (TREAT PVC): study protocol for a multi-center, double-blind, randomized controlled trial Trials 24:683. https://doi.org/10.1186/s13063-023-07713-2 PubMed Google Scholar Chang-Chretien K Chew JT Judge DP (2004) Reversible dilated cardiomyopathy associated with glucagonoma Heart 90:e44. https://doi.org/10.1136/hrt.2004.036905 PubMed Google Scholar D’Alessio D (2011) The role of dysregulated glucagon secretion in type 2 diabetes Diabetes, Obesity & Metabolism 13 Suppl 1:126–132. https://doi.org/10.1111/j.1463-1326.2011.01449.x PubMed Google Scholar Ding M Li QF Yin G Liu JL Jan XY Huang T Li AC Zheng L (2022) Effects of Drosophila melanogaster regular exercise and apolipoprotein B knockdown on abnormal heart rhythm induced by a high-fat diet PLOS ONE 17:e0262471. https://doi.org/10.1371/journal.pone.0262471 PubMed Google Scholar Dulcis D Levine RB (2003) Innervation of the heart of the adult fruit fly, Drosophila melanogaster The Journal of Comparative Neurology 465:560–578. https://doi.org/10.1002/cne.10869 PubMed Google Scholar Dulcis D Levine RB (2005a) Glutamatergic innervation of the heart initiates retrograde contractions in adult Drosophila melanogaster The Journal of Neuroscience 25:271–280. https://doi.org/10.1523/JNEUROSCI.2906-04.2005 PubMed Google Scholar Dulcis D Levine RB Ewer J (2005b) Role of the neuropeptide CCAP in Drosophila cardiac function Journal of Neurobiology 64:259–274. https://doi.org/10.1002/neu.20136 PubMed Google Scholar Farah A Tuttle R (1960) Studies on the pharmacology of glucagon The Journal of Pharmacology and Experimental Therapeutics 129:49–55. PubMed Google Scholar Freeman AG (1951) Electrocardiographic findings during operative manipulation of the viscera and vagus nerves The Lancet 257:926–931. https://doi.org/10.1016/S0140-6736(51)92449-X PubMed Google Scholar González ML Pividori SM Fosser G Pontecorvo AA Franco-Riveros VB Tubbs RS Boezaart AP Reina MA Buchholz B (2023) Innervation of the heart: Anatomical study with application to better understanding pathologies of the cardiac autonomics Clinical Anatomy 36:550–562. https://doi.org/10.1002/ca.24017 PubMed Google Scholar Grönke S Müller G Hirsch J Fellert S Andreou A Haase T Jäckle H Kühnlein RP (2007) Dual lipolytic control of body fat storage and mobilization in Drosophila PLOS Biology 5:e137. https://doi.org/10.1371/journal.pbio.0050137 PubMed Google Scholar Gupta V Munjal JS Jhajj P Jhajj S Jain R (2022) Obesity and atrial fibrillation: a narrative review Cureus 14:e31205. https://doi.org/10.7759/cureus.31205 PubMed Google Scholar Habegger KM Heppner KM Geary N Bartness TJ DiMarchi R Tschöp MH (2010) The metabolic actions of glucagon revisited Nature Reviews. Endocrinology 6:689–697. https://doi.org/10.1038/nrendo.2010.187 PubMed Google Scholar Heppner KM Habegger KM Day J Pfluger PT Perez-Tilve D Ward B Gelfanov V Woods SC DiMarchi R Tschöp M (2010) Glucagon regulation of energy metabolism Physiology & Behavior 100:545–548. https://doi.org/10.1016/j.physbeh.2010.03.019 PubMed Google Scholar Huang R Song T Su H Lai Z Qin W Tian Y Dong X Wang L (2020) High-fat diet enhances starvation-induced hyperactivity via sensitizing hunger-sensing neurons in Drosophila eLife 9:e53103. https://doi.org/10.7554/eLife.53103 PubMed Google Scholar Hurwitz RA (1973) Effect of glucagon on infants and children with atrioventricular heart block British Heart Journal 35:1260–1264. https://doi.org/10.1136/hrt.35.12.1260 PubMed Google Scholar Huxley RR Filion KB Konety S Alonso A (2011) Meta-analysis of cohort and case-control studies of type 2 diabetes mellitus and risk of atrial fibrillation The American Journal of Cardiology 108:56–62. https://doi.org/10.1016/j.amjcard.2011.03.004 PubMed Google Scholar Isabel G Martin JR Chidami S Veenstra JA Rosay P (2005) AKH-producing neuroendocrine cell ablation decreases trehalose and induces behavioral changes in Drosophila American Journal of Physiology. Regulatory, Integrative and Comparative Physiology 288:R531–R538. https://doi.org/10.1152/ajpregu.00158.2004 PubMed Google Scholar Jaca IJ Desai D Barkin JS (2002) Paroxysmal supraventricular tachycardia after administration of glucagon during upper endoscopy Gastrointestinal Endoscopy 56:304. https://doi.org/10.1016/s0016-5107(02)70199-5 PubMed Google Scholar Kannel WB Abbott RD Savage DD McNamara PM (1983) Coronary heart disease and atrial fibrillation: the framingham study American Heart Journal 106:389–396. https://doi.org/10.1016/0002-8703(83)90208-9 PubMed Google Scholar Kannel WB Wolf PA Benjamin EJ Levy D (1998) Prevalence, incidence, prognosis, and predisposing conditions for atrial fibrillation: population-based estimates The American Journal of Cardiology 82:2N–9N. https://doi.org/10.1016/s0002-9149(98)00583-9 PubMed Google Scholar Kazda CM Ding Y Kelly RP Garhyan P Shi C Lim CN Fu H Watson DE Lewin AJ Landschulz WH Deeg MA Moller DE Hardy TA (2016) Evaluation of efficacy and safety of the glucagon receptor antagonist LY2409021 in patients with type 2 diabetes: 12- and 24-week phase 2 studies Diabetes Care 39:1241–1249. https://doi.org/10.2337/dc15-1643 PubMed Google Scholar Kharbanda RK Ramdat Misier NL van Schie MS Zwijnenburg RD Amesz JH Knops P Bogers AJJC Taverne YJHJ de Groot NMS (2023) Insights into the effects of low-level vagus nerve stimulation on atrial electrophysiology: towards patient-tailored cardiac neuromodulation JACC. Clinical Electrophysiology 9:1843–1853. https://doi.org/10.1016/j.jacep.2023.05.011 PubMed Google Scholar Kim SK Rulifson EJ (2004) Conserved mechanisms of glucose sensing and regulation by Drosophila corpora cardiaca cells Nature 431:316–320. https://doi.org/10.1038/nature02897 PubMed Google Scholar Kodde IF van der Stok J Smolenski RT de Jong JW (2007) Metabolic and genetic regulation of cardiac energy substrate preference Comparative Biochemistry and Physiology. Part A, Molecular & Integrative Physiology 146:26–39. https://doi.org/10.1016/j.cbpa.2006.09.014 PubMed Google Scholar Kusumoto FM Schoenfeld MH Barrett C Edgerton JR Ellenbogen KA Gold MR Goldschlager NF Hamilton RM Joglar JA (2019) 2018 ACC/AHA/HRS guideline on the evaluation and management of patients with bradycardia and cardiac conduction delay: executive summary: a report of the american college of cardiology/american heart association task force on clinical practice guidelines and the heart rhythm society Circulation 140:E333–E381. https://doi.org/10.1161/CIR.0000000000000627 Google Scholar Lee G Park JH (2004) Hemolymph sugar homeostasis and starvation-induced hyperactivity affected by genetic manipulations of the adipokinetic hormone-encoding gene in Drosophila melanogaster Genetics 167:311–323. https://doi.org/10.1534/genetics.167.1.311 PubMed Google Scholar Lee H Choi EK Lee SH Han KD Rhee TM Park CS Lee SR Choe WS Lim WH Kang SH Cha MJ Oh S (2017) Atrial fibrillation risk in metabolically healthy obesity: a nationwide population-based study International Journal of Cardiology 240:221–227. https://doi.org/10.1016/j.ijcard.2017.03.103 PubMed Google Scholar Lee PT Zirin J Kanca O Lin WW Schulze KL Li-Kroeger D Tao R Devereaux C Hu Y Chung V Fang Y He Y Pan H Ge M Zuo Z Housden BE Mohr SE Yamamoto S Levis RW Spradling AC Perrimon N Bellen HJ (2018) A gene-specific T2A-GAL4 library for Drosophila eLife 7:35574. https://doi.org/10.7554/eLife.35574 Google Scholar Liao S Amcoff M Nässel DR (2021) Impact of high-fat diet on lifespan, metabolism, fecundity and behavioral senescence in Drosophila Insect Biochemistry and Molecular Biology 133:103495. https://doi.org/10.1016/j.ibmb.2020.103495 PubMed Google Scholar Lucchesi BR Brown J Laidlaw B Rockiki D (1968) Cardiac actions of glucagon Circulation Research 22:777–787. https://doi.org/10.1161/01.res.22.6.777 PubMed Google Scholar Markiewicz K Cholewa M Górski L (1978) Cardiac arrhythmias after intravenous administration of glucagon European Journal of Cardiology 6:449–458. PubMed Google Scholar Masuyama K Zhang Y Rao Y Wang JW (2012) Mapping neural circuits with activity-dependent nuclear import of a transcription factor Journal of Neurogenetics 26:89–102. https://doi.org/10.3109/01677063.2011.642910 PubMed Google Scholar Mukharji A Drucker DJ Charron MJ Swoap SJ (2013) Oxyntomodulin increases intrinsic heart rate through the glucagon receptor Physiological Reports 1:e00112. https://doi.org/10.1002/phy2.112 PubMed Google Scholar Nattel S Guasch E Savelieva I Cosio FG Valverde I Halperin JL Conroy JM Al-Khatib SM Hess PL Kirchhof P De Bono J Lip GYH Banerjee A Ruskin J Blendea D Camm AJ (2014) Early management of atrial fibrillation to prevent cardiovascular complications European Heart Journal 35:1448–1456. https://doi.org/10.1093/eurheartj/ehu028 PubMed Google Scholar Neumann J Hofmann B Dhein S Gergs U (2023) Glucagon and its receptors in the mammalian heart International Journal of Molecular Sciences 24:12829. https://doi.org/10.3390/ijms241612829 PubMed Google Scholar Noyes BE Katz FN Schaffer MH (1995) Identification and expression of the Drosophila adipokinetic hormone gene Molecular and Cellular Endocrinology 109:133–141. https://doi.org/10.1016/0303-7207(95)03492-p PubMed Google Scholar Ocorr K Reeves NL Wessells RJ Fink M Chen HSV Akasaka T Yasuda S Metzger JM Giles W Posakony JW Bodmer R (2007) KCNQ potassium channel mutations cause cardiac arrhythmias in Drosophila that mimic the effects of aging PNAS 104:3943–3948. https://doi.org/10.1073/pnas.0609278104 PubMed Google Scholar Pearson MJ Unger RH Holland WL (2016) Clinical trials, triumphs, and tribulations of glucagon receptor antagonists Diabetes Care 39:1075–1077. https://doi.org/10.2337/dci15-0033 PubMed Google Scholar Powell-Wiley TM Poirier P Burke LE Després JP Gordon-Larsen P Lavie CJ Lear SA Ndumele CE Neeland IJ Sanders P St-Onge MP Null N (2021) Obesity and cardiovascular disease: a scientific statement from the american heart association Circulation 143:e984–e1010. https://doi.org/10.1161/CIR.0000000000000973 PubMed Google Scholar Radulescu A Gannon MC Nuttall FQ (2010) The effect on glucagon, glucagon-like peptide-1, total and acyl-ghrelin of dietary fats ingested with and without potato The Journal of Clinical Endocrinology & Metabolism 95:3385–3391. https://doi.org/10.1210/jc.2009-2559 PubMed Google Scholar Roberts-Thomson KC Lau DH Sanders P (2011) The diagnosis and management of ventricular arrhythmias Nature Reviews. Cardiology 8:311–321. https://doi.org/10.1038/nrcardio.2011.15 PubMed Google Scholar Schneider CA Rasband WS Eliceiri KW (2012) NIH Image to ImageJ: 25 years of image analysis Nature Methods 9:671–675. https://doi.org/10.1038/nmeth.2089 PubMed Google Scholar Scott RS Espiner EA Donald RA Ellis MJ (1980) Free insulin, C-peptide and glucagon profiles in insulin dependent diabetes mellitus Australian and New Zealand Journal of Medicine 10:146–150. https://doi.org/10.1111/j.1445-5994.1980.tb03702.x PubMed Google Scholar Sowden GL Drucker DJ Weinshenker D Swoap SJ (2007) Oxyntomodulin increases intrinsic heart rate in mice independent of the glucagon-like peptide-1 receptor American Journal of Physiology. Regulatory, Integrative and Comparative Physiology 292:R962–R970. https://doi.org/10.1152/ajpregu.00405.2006 PubMed Google Scholar Staubli F Jorgensen TJD Cazzamali G Williamson M Lenz C Sondergaard L Roepstorff P Grimmelikhuijzen CJP (2002) Molecular identification of the insect adipokinetic hormone receptors PNAS 99:3446–3451. https://doi.org/10.1073/pnas.052556499 PubMed Google Scholar Stern JH Smith GI Chen S Unger RH Klein S Scherer PE (2019) Obesity dysregulates fasting-induced changes in glucagon secretion The Journal of Endocrinology 243:149–160. https://doi.org/10.1530/JOE-19-0201 PubMed Google Scholar Unger RH Aguilar-Parada E Müller WA Eisentraut AM (1970) Studies of pancreatic alpha cell function in normal and diabetic subjects The Journal of Clinical Investigation 49:837–848. https://doi.org/10.1172/JCI106297 PubMed Google Scholar van Weperen VYH Vaseghi M (2023) Cardiac vagal afferent neurotransmission in health and disease: review and knowledge gaps Frontiers in Neuroscience 17:1192188. https://doi.org/10.3389/fnins.2023.1192188 PubMed Google Scholar Vuguin PM Charron MJ (2011) Novel insight into glucagon receptor action: lessons from knockout and transgenic mouse models Diabetes, Obesity & Metabolism 13 Suppl 1:144–150. https://doi.org/10.1111/j.1463-1326.2011.01447.x PubMed Google Scholar Wang TJ Parise H Levy D D’Agostino RB Sr Wolf PA Vasan RS Benjamin EJ (2004) Obesity and the risk of new-onset atrial fibrillation JAMA 292:2471–2477. https://doi.org/10.1001/jama.292.20.2471 PubMed Google Scholar Yelbuz TM Choma MA Thrane L Kirby ML Izatt JA (2002) Optical coherence tomography: a new high-resolution imaging technology to study cardiac development in chick embryos Circulation 106:2771–2774. https://doi.org/10.1161/01.cir.0000042672.51054.7b PubMed Google Scholar Yu Y Huang R Ye J Zhang V Wu C Cheng G Jia J Wang L (2016) Regulation of starvation-induced hyperactivity by insulin and glucagon signaling in adult Drosophila eLife 5:e15693. https://doi.org/10.7554/eLife.15693 PubMed Google Scholar Zhang K Lehner LJ Praeger D Baumann G Knebel F Quinkler M Roepke TK (2014) Glucagonoma-induced acute heart failure Endocrinology, Diabetes & Metabolism Case Reports 2014:140061. https://doi.org/10.1530/EDM-14-0061 PubMed Google Scholar Zhao Y Khallaf MA Johansson E Dzaki N Bhat S Alfredsson J Duan J Hansson BS Knaden M Alenius M (2022) Hedgehog-mediated gut-taste neuron axis controls sweet perception in Drosophila Nature Communications 13:7810. https://doi.org/10.1038/s41467-022-35527-4 PubMed Google Scholar Zhao Y Johansson E Duan J Han Z Alenius M (2023) Fat- and sugar-induced signals regulate sweet and fat taste perception in Drosophila Cell Reports 42:113387. https://doi.org/10.1016/j.celrep.2023.113387 PubMed Google Scholar Zhao Y Duan J Seah H van de Leemput J Han Z (2025) JAK-STAT pathway activation compromises nephrocyte function in a Drosophila high-fat diet model of chronic kidney disease eLife 13:RP96987. https://doi.org/10.7554/eLife.96987 PubMed Google Scholar Article and author information Author details Yunpo Zhao Center for Precision Disease Modeling, Department of Medicine, University of Maryland School of Medicine, Baltimore, United States Division of Endocrinology, Diabetes and Nutrition, Department of Medicine, University of Maryland School of Medicine, Baltimore, United States Contribution Conceptualization, Formal analysis, Investigation, Visualization, Methodology, Writing – original draft, Writing – review and editing Competing interests No competing interests declared "This ORCID iD identifies the author of this article:" 0000-0002-7942-3406 Jianli Duan Center for Precision Disease Modeling, Department of Medicine, University of Maryland School of Medicine, Baltimore, United States Division of Endocrinology, Diabetes and Nutrition, Department of Medicine, University of Maryland School of Medicine, Baltimore, United States Contribution Conceptualization, Formal analysis, Investigation, Methodology Competing interests No competing interests declared Joyce van de Leemput Center for Precision Disease Modeling, Department of Medicine, University of Maryland School of Medicine, Baltimore, United States Division of Endocrinology, Diabetes and Nutrition, Department of Medicine, University of Maryland School of Medicine, Baltimore, United States Contribution Writing – original draft, Writing – review and editing Competing interests No competing interests declared Zhe Han Center for Precision Disease Modeling, Department of Medicine, University of Maryland School of Medicine, Baltimore, United States Division of Endocrinology, Diabetes and Nutrition, Department of Medicine, University of Maryland School of Medicine, Baltimore, United States Contribution Conceptualization, Supervision, Funding acquisition, Writing – original draft, Writing – review and editing For correspondence zhan@som.umaryland.edu Competing interests No competing interests declared "This ORCID iD identifies the author of this article:" 0000-0002-5177-7798 Funding National Heart Lung and Blood Institute (R01-HL180768) Zhe Han Eunice Kennedy Shriver National Institute of Child Health and Human Development (R01-HD111480) Zhe Han National Heart Lung and Blood Institute (R01-HL134940) Zhe Han The funders had no role in study design, data collection and interpretation, or the decision to submit the work for publication. Acknowledgements We would like to thank the Bloomington Drosophila Stock Center (BDSC) based at Indiana University Bloomington (Bloomington, IN) for the Drosophila stocks, Prof. Jae Park (the University of Tennessee) for providing the antibodies, and the Developmental Studies Hybridoma Bank (DSHB) based at the University of Iowa (Iowa City, IA) for providing the antibodies. This work was supported by National Institutes of Health grants NHLBI R01-HL134940 (ZH), R01-HL180768 (ZH), and NICHD R01-HD111480 (ZH). Version history Preprint posted: December 13, 2023 Sent for peer review: December 13, 2023 Reviewed Preprint version 1: May 7, 2024 Reviewed Preprint version 2: June 16, 2025 Reviewed Preprint version 3: January 19, 2026 Version of Record published: March 6, 2026 Cite all versions You can cite all versions using the DOI https://doi.org/10.7554/eLife.94512. This DOI represents all versions, and will always resolve to the latest one. Copyright © 2024, Zhao et al.This article is distributed under the terms of the Creative Commons Attribution License, which permits unrestricted use and redistribution provided that the original author and source are credited. Metrics 1,154 views 36 downloads 1 citation Views, downloads and citations are aggregated across all versions of this paper published by eLife. Citations by DOI 1 citation for Reviewed Preprint v1 https://doi.org/10.7554/eLife.94512.1 Download links A two-part list of links to download the article, or parts of the article, in various formats. Downloads (link to download the article as PDF) Article PDF Figures PDF Open citations (links to open the citations from this article in various online reference manager services) Mendeley Cite this article (links to download the citations from this article in formats compatible with various reference manager tools) Yunpo Zhao Jianli Duan Joyce van de Leemput Zhe Han (2026) Cardiac neurons expressing a glucagon-like receptor mediate cardiac arrhythmia induced by high-fat diet in Drosophila eLife 13:RP94512. https://doi.org/10.7554/eLife.94512.4 Download BibTeX Download .RIS Share this article https://doi.org/10.7554/eLife.94512 Bluesky Streamline Icon: https://streamlinehq.com Bluesky Threads Fill Streamline Icon: https://streamlinehq.com Categories and tags Research Article Cell Biology cardiac neurons AkhR adipokinetic hormone (Akh) glucagon cardiac arrhythmia high-fat diet Akh Research organism D. melanogaster

来源:e life发布时间:2026-03-06
经济命脉极度依赖霍尔木兹海峡,日本油企申请释放国家战略储备原油

受地理位置限制,以及外交战略绑定影响,霍尔木兹海峡航道停滞使得日本经济面临致命打击的威胁。 日本超过90%的原油进口来自中东地区,其中约70%-80%的油轮必须借道这个全球能源命脉咽喉。而该国的汽车、电子、化工、钢铁等优势产业均为能源密集型。 据央视报道,部分日本炼油企业近日已向日本政府申请释放国家战略储备原油来应对潜在的能源危机。 根据2015年通过的安保关联法,日本政府曾将“霍尔木兹海峡被水雷封锁”列为可行使集体自卫权的“存亡危机事态”触发条件。时任首相安倍晋三表示,在这个情境下,日本政府可派遣自卫队前往扫雷。 另外,日本的外交和安全政策高度依附美国,只能被动跟随前者的政策。因此,与其他主要经济体相比,日本的替代能力近乎为空白。 2022年以来,日本跟随美国对俄罗斯实施制裁,但遭到莫斯科方面的强硬反制。俄罗斯于2025年9月对在俄的日资资产进行清退,迫使日本彻底转向中东现货市场。 去年7月,石破茂内阁承诺对美投资5500亿美元,以作为美国将日本汽车及零部件关税从25%降至15%的交换。截至本文发稿,其中首批360亿美元已投向美国得州石油港口、俄亥俄州燃气发电厂等能源基础设施。 有分析认为,若霍尔木兹海峡封锁持续数月,日本能源储备将迅速耗尽,电力、交通、工业生产将面临停摆风险。在最坏的情况下,日本经济年度增幅缩水0.65个百分点。 截至目前至少有44艘与日本相关的船只滞留在波斯湾内,大部份为运输原油和液化天然气等能源的相关船只。3月5日,日本资本市场陷入恐慌性抛售。 全球商业支付公司Convera的亚太区首席宏观和外汇策略师Shier lee Lim表示,即使没有出现完全短缺,价格影响也会十分严重,日本等高度依赖能源进口的亚洲经济体更容易受到供应冲击的影响。 联合海上信息中心(JMIC)3月6日发布报告显示,霍尔木兹海峡的船舶交通几乎完全停滞。该中心近期的评估表明,通行船只数量已降至个位数水平,过去24小时内仅观测到两起确认的商业通行,这些通行涉及的是货船而不是石油船。 当天,供应中断的担忧及航运成本抬升继续推动油价大幅上涨,布伦特原油期货向上触及90美元/桶,盘中大涨5.3%,续创2024年4月以来新高。全球基准布伦特原油本周累计上涨23%。

来源:界面新闻发布时间:2026-03-06
联合国难民署称中东地区危机构成“重大人道主义紧急事件”

联合国难民署分管紧急情况和项目支援的负责人伊藤礼树3月6日称,中东地区不断升级的危机已构成一场“重大人道主义紧急事件”。 伊藤当天在瑞士日内瓦的一场例行记者会上说,近期中东地区局势升级,袭击持续发生,引发了伊朗、伊朗周边国家以及更广泛地区的人口流动。受影响地区难民已经达到2500万人。美国与以色列对伊朗发动打击后的最初两天,伊朗官方数字显示已有约10万人离开家园,但这一数字很可能被极大低估。 伊藤表示,联合国难民署工作人员正努力向受影响国家提供人道主义援助。他敦促有关方面为需要转移或跨境的民众提供安全通道。(新华社)

来源:界面新闻发布时间:2026-03-06
美国2月非农就业人数减少9.2万

美国2月非农就业人数减少9.2万,预估为增加5.5万,前值为增加13万。

来源:界面新闻发布时间:2026-03-06
持续打造“购在中国”品牌,商务部部长:将出台离境退税2.0版等更多增量政策

记者 辛圆 十四届全国人大四次会议今天举行经济主题记者会。 在记者会上,商务部部长王文涛表示,狭义的“购在中国”是吸引更多的国际游客入境消费、观光购物,广义的“购在中国”是我国老百姓在国内能够购买到国外的优质产品,实现“在中国,购全球”。 “商务部支持更多的全球优质商品和服务进入中国,我们是站在贸易伙伴的角度、从进出口平衡发展的角度,向各国发出了共享中国大市场机遇的诚挚邀约,这是扩大自主开放、共同做大合作‘蛋糕’的主动作为。”王文涛说。 王文涛表示,今年商务部将从办活动、出政策、优场景三方面持续打造“购在中国”品牌。 办活动方面,王文涛表示,今年会有N场特色活动和15场城市专场活动。出政策方面,商务部将出台商品消费扩容升级、离境退税2.0版等政策,更方便、更扩容。优场景方面,商务部将深化国际消费中心城市建设,开展国际化消费环境建设试点。 关于“出口中国”,王文涛表示,今年2月在北京举办了首场活动,全年将举办超百场系列活动。重点在三个方面发力。 具体来看,王文涛提到,一是加强活动互促。线上线下协同发力,搭建更多对接渠道和进口商品促消费场景。二是强化供需互配。商务部将发掘“各国所优”和“中国所需”,发布《出口中国能力发展报告》,对一些国家出口中国的能力进行评估,商务部会帮助这些国家提高出口中国的能力,促进供需精准匹配。三是深化国际互动。今年“出口中国”邀请了英国、哈萨克斯坦、肯尼亚、泰国等作为主题国,“一国一策”加强对接。 投资中国方面,王文涛表示,商务部将继续擦亮“投资中国”的金字招牌。 一是活动更“精”。王文涛提到,商务部将围绕当前外资企业关注的新赛道,比如六大未来产业等,提升产业对接的精准度、投资中国的精准度。 二是服务更“优”。商务部现在有多层级的对接机制,包括外资企业圆桌会议等,接下来将继续用好这些机制,把企业“需求清单”变成“服务清单”。 三是平台更“佳”。商务部表示,将继续办好投洽会,提升自贸试验区、国家级经开区等开放平台能级,欢迎更多的外资企业到中国投资。 “现在很多外资企业把中国市场看成是‘健身房’和 ‘试验场’,我们有超大规模的市场,有非常丰富的场景,这就成为外资企业创新、研发的试验场、应用场。”王文涛说。

来源:界面新闻发布时间:2026-03-06
美国2月失业率为4.4%

美国2月失业率为4.4%,预估为4.3%,前值为4.3%。

来源:界面新闻发布时间:2026-03-06
共72741条记录
  • 1
  • 2
  • 3
  • 4
  • 6062

产业专题

产业大脑平台

产业经济-监测、分析、

研判、预警

数智招商平台

找方向、找目标、管过程

产业数据库

产业链 200+

产业环节 10000+

产业数据 100亿+

企业数据库

工商 司法 专利

信用 风险 产品

招投标 投融资

报告撰写AI智能体

分钟级生成各类型报告